Streamline OpenSearch Dashboards development with VS Code
Developing OpenSearch Dashboards (OSD) can feel overwhelming, whether you’re setting up your environment for the first time or starting work on a significant feature. This blog post introduces developer tools and workflows in VS Code that make OSD development more manageable and efficient.
VS Code provides many built-in capabilities, such as IntelliSense, code search, and Git integration. In this post, you’ll learn how to configure the following:
- Unit tests that are easy to run and debug at the individual test level.
- A linter that runs automatically on save using OSD rules, eliminating the need to run the linter at commit time and recommit changes (though some linting errors will still require manual fixes).
- A one-click OSD server startup and server-side debugging.
- Multi-root workspaces for development on both individual plugins and OSD Core.
Setting up Jest integration
OSD uses Jest as the testing framework. With over 2,000 test suites in OSD alone, finding and running specific tests can be a hassle.
The vscode-jest extension provides a quick and easy Jest integration in VS Code, as shown in the following image.
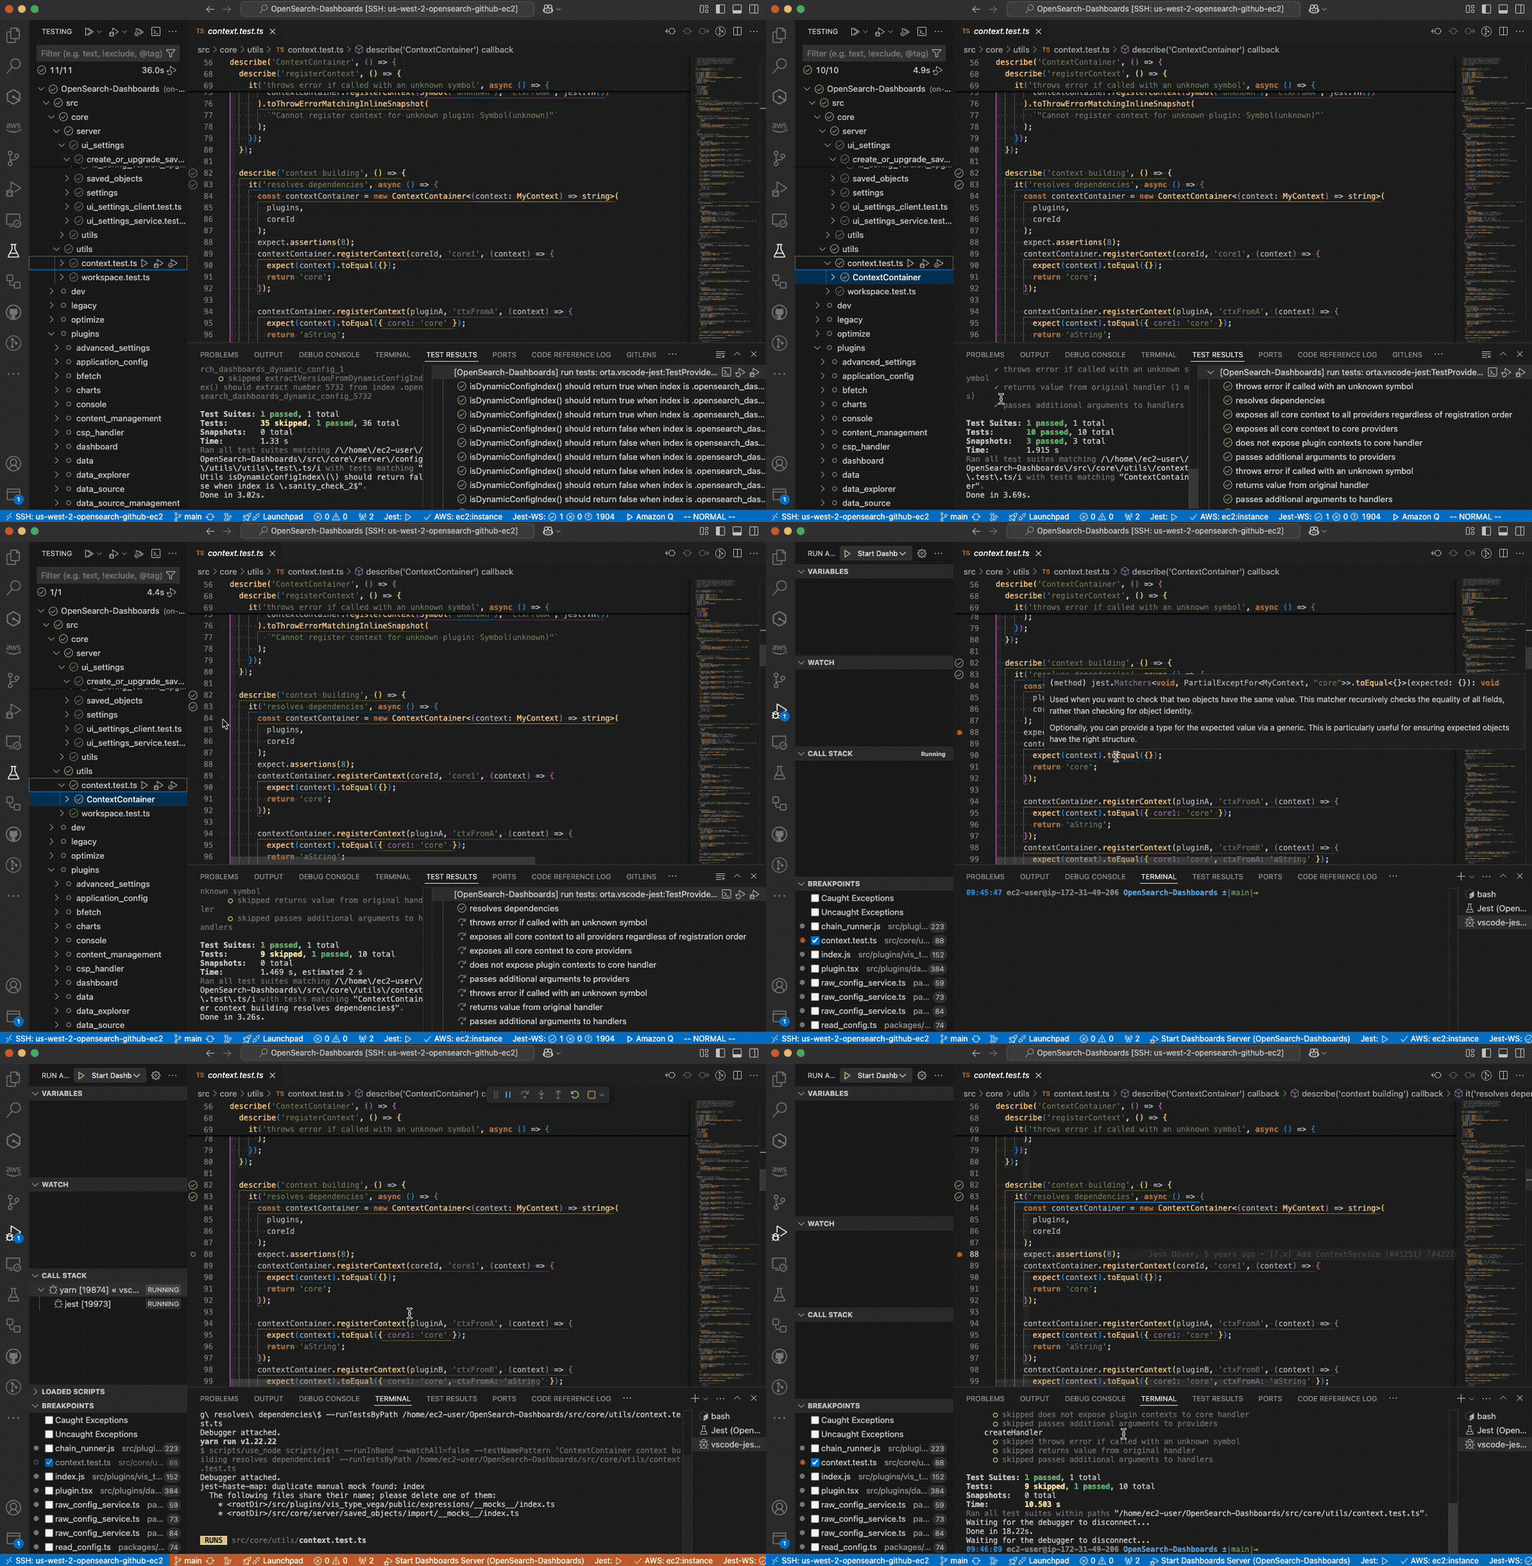
Here are a few Jest features:
- A graphical interface used to select which tests to run: you can run all project tests, tests inside a specific directory, specific test files, individual test suites, or even individual test methods.
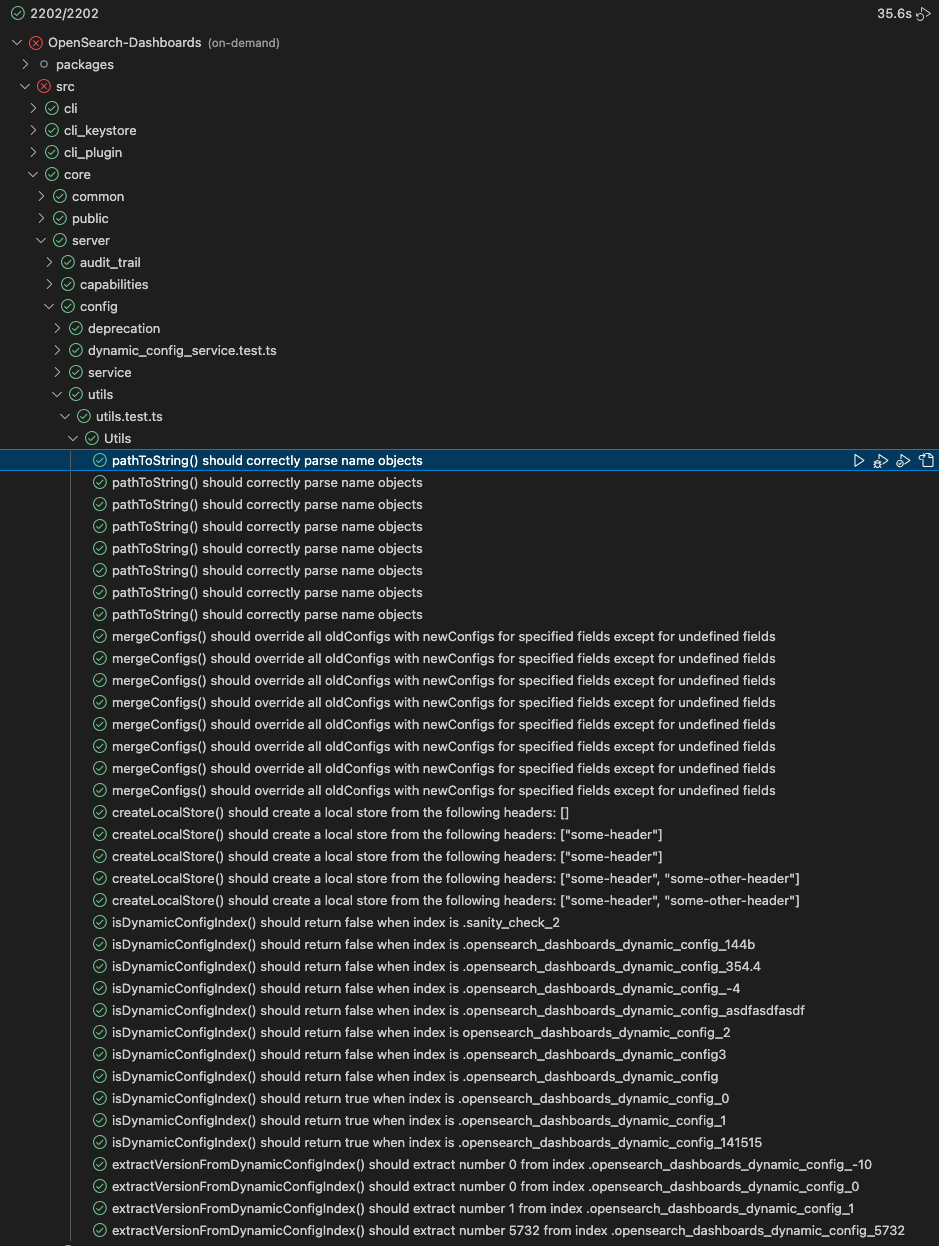
- A UI icon that displays passed or failed tests.
- An inline
Test Runbutton in your test files so you don’t have to run tests in the command line.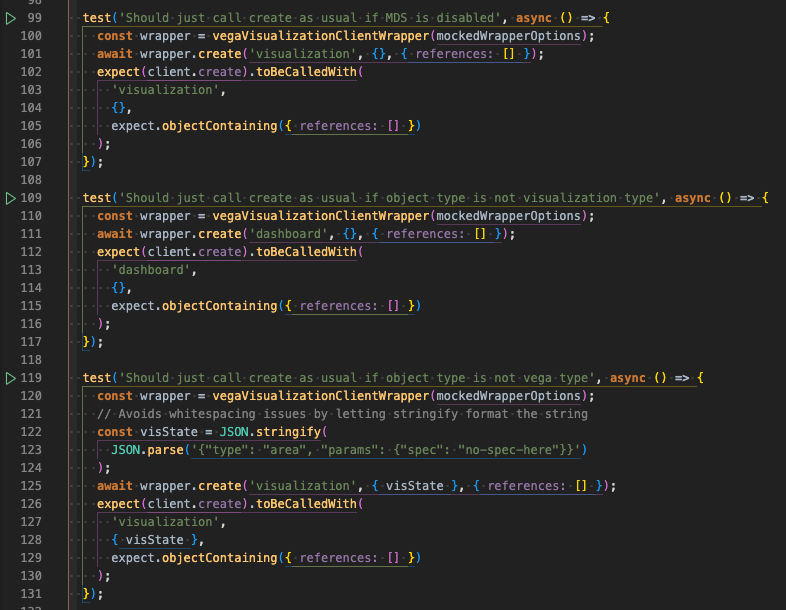
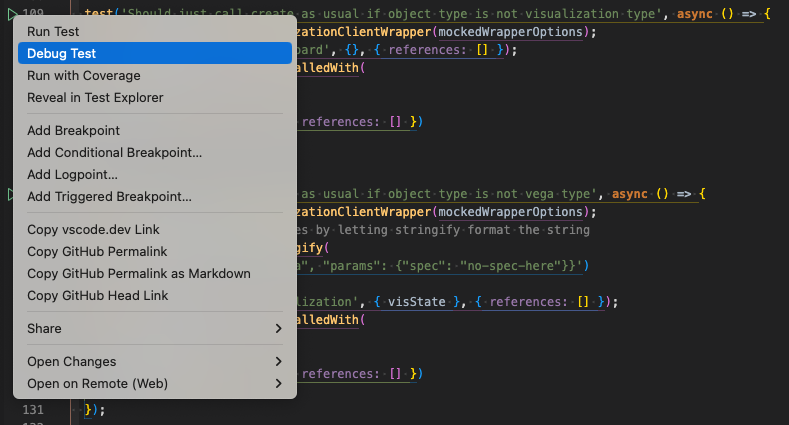
- The ability to run a test with debug options.
Note: Do not run all tests under src/plugins*. There are over 2,000 test cases, so running all tests will consume lots of resources. Instead, run tests on demand for specific subdirectories.
Configuring Jest
- Install the
vscode-jestextension. - Open your workspace settings by pressing
Cmd(orCtrl) +Shift+Pand selecting Open Workspace Settings (JSON). If you want the settings to persist globally across all your projects, select Open User Settings (JSON). Because the following step will only apply to theOpenSearch-Dashboardsrepo, we recommend making these changes a Workspace Setting (internally, VS Code will create a.vscodedirectory in the workspace root and place asettings.jsonfile inside.vscode). -
Add the following settings to the
settings.jsonfile:{ "jest.jestCommandLine": "yarn test:jest", "jest.runMode": "on-demand" }
The first line will use the custom jest.js OSD script to load the custom config.js file and pass any arguments directly to jest. The second line prevents the test runner from running every test on file save, which helps to save computing resources.
After performing these steps, you should see the Test Explorer (![]() ) icon in the Extensions sidebar. Select this icon to view all detected test files.
) icon in the Extensions sidebar. Select this icon to view all detected test files.
Configuring Prettier and ESLint integration
The OSD repo includes Husky, a precommit hook that runs scripts before commits are made (scripts may include linting or running unit tests). However, rerunning the linter and recommitting your changes may still be time-consuming. VS Code provides the ability to lint on save, but OSD has specific linting rules that may not work out of the box.
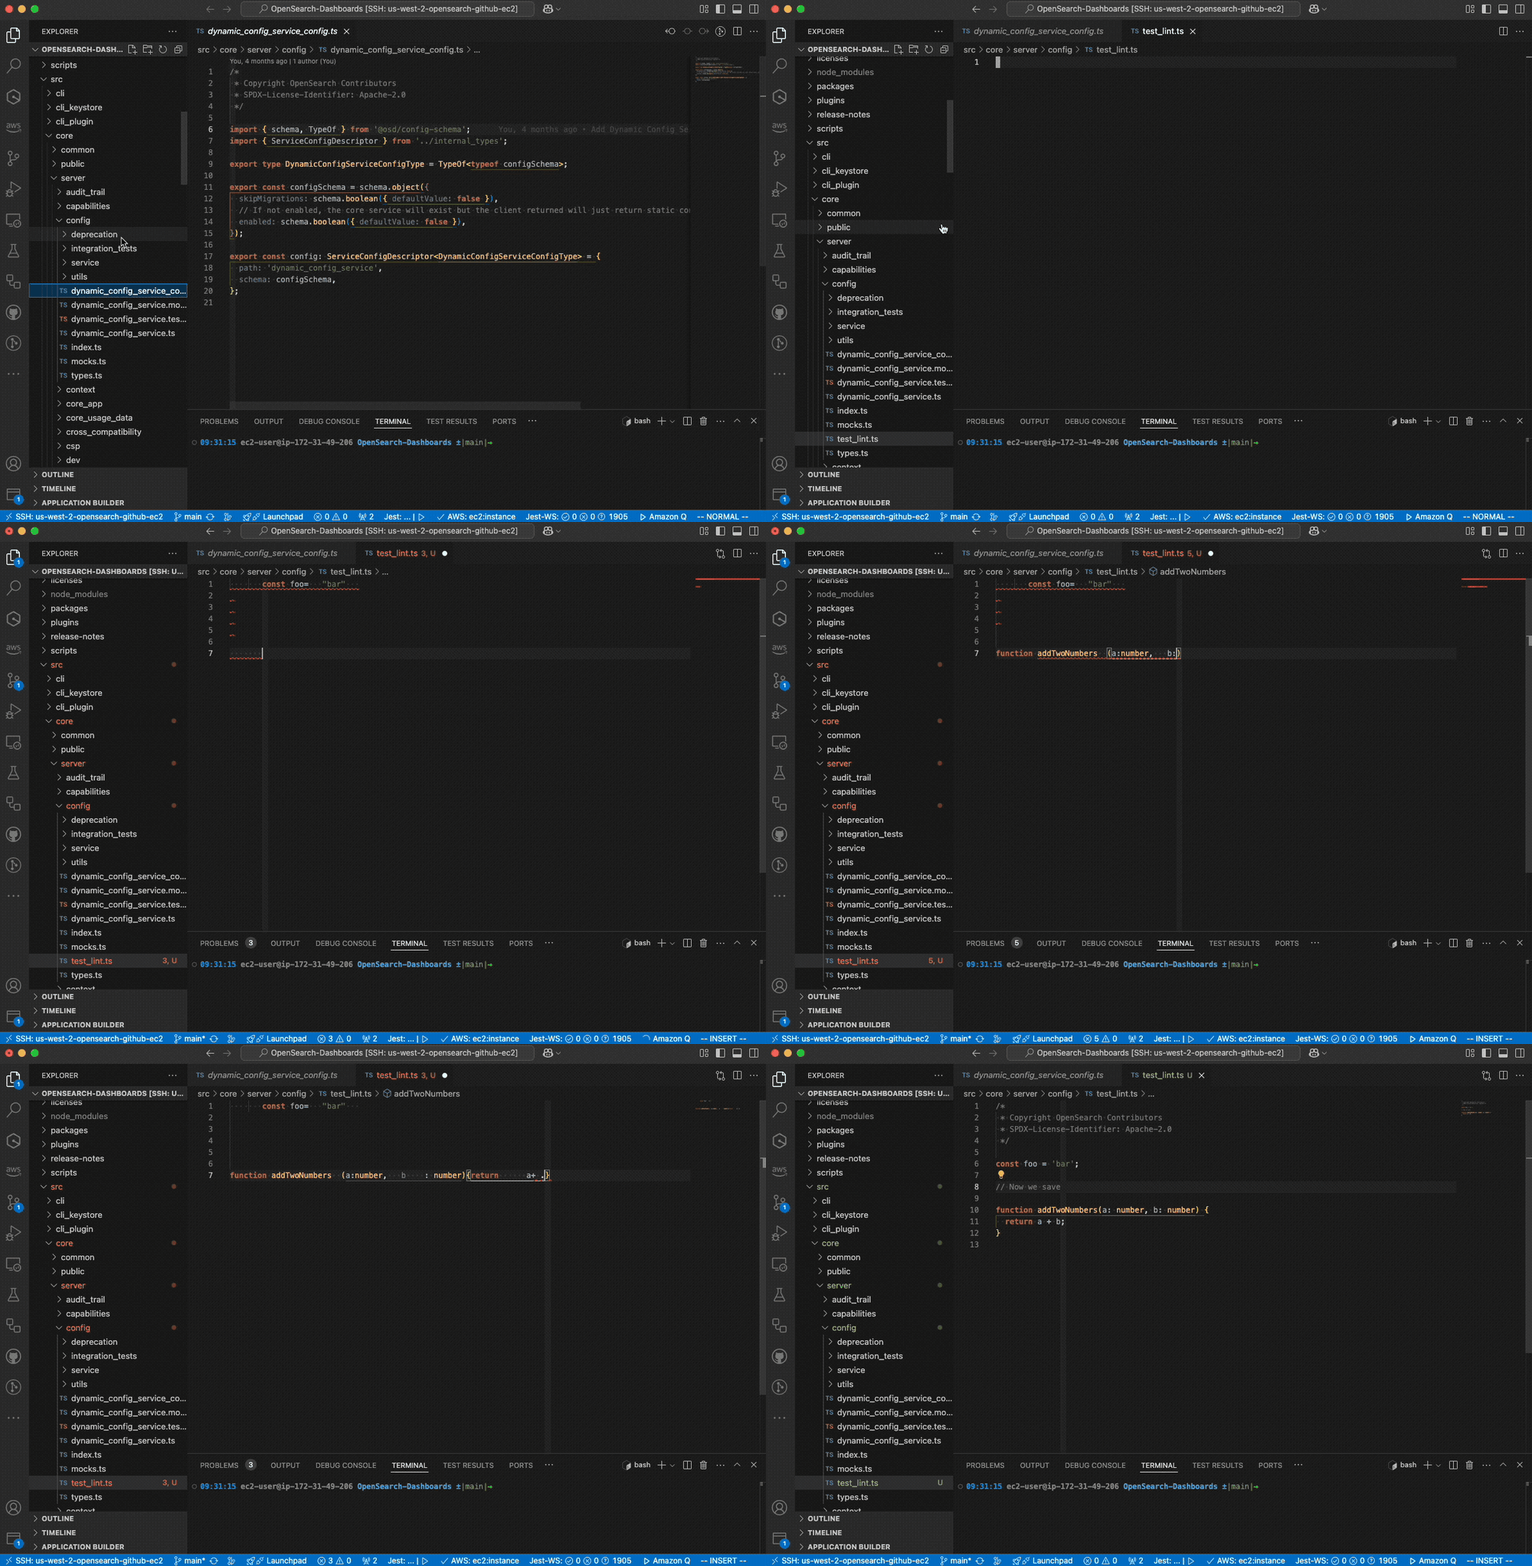
You can use the Prettier and ESLint VS Code plugins to lint files automatically on save. Note that some rules that cannot be fixed automatically will still require manual corrections. The Prettier plugin is configured using the .prettierrc config file and will execute the Prettier rules in VS Code. ESLint is configured using the workspace’s ESLInt configuration to enforce its rules. The linting integration is shown in the following image.
Prerequisites
Before you start, configure linting on save by pressing Cmd (or Ctrl) + Shift + P and selecting Open User Settings (JSON) so you can save this setting across all your projects:
{
    "editor.formatOnSave": true
}
Setup
- Install the Prettier and ESLint extensions.
- Press
Cmd(orCtrl) +Shift+Pand select Open Workspace Settings (JSON). -
Add the following settings to the
settings.jsonfile:{ "prettier.configPath": ".prettierrc", "editor.defaultFormatter": "esbenp.prettier-vscode", "eslint.autoFixOnSave": true, "editor.codeActionsOnSave": { "source.fixAll.eslint": true }, }Note: If you already have some settings in the
editor.codeActionsOnSavesetting, append"source.fixAll.eslint": trueto the existing settings.
Now, when you save a file, the file is linted automatically.
Configuring OSD server run tasks
Starting the OSD server typically requires running commands in two terminals:
- In the first terminal, run
yarn opensearch snapshot. - After several seconds, in the second terminal, run
yarn run start --no-base-path.
This approach works for many use cases but doesn’t allow you to debug server-side changes. To simplify this process, you can set up a series of launch tasks, turning server startup into a one-click operation:
- Start the OpenSearch server.
- Start the Dashboards server. Starting the Dashboards server requires a wait period while the server boots up; this can be accomplished with a VS Code task that specifies to wait for a certain period of time.
Making this task a VS Code run configuration provides the following benefits:
- One-click OSD development server startup, eliminating the need to repeatedly use the CLI.
- The ability to debug server-side code (for client-side code [public], you can use your preferred browser’s developer tools).
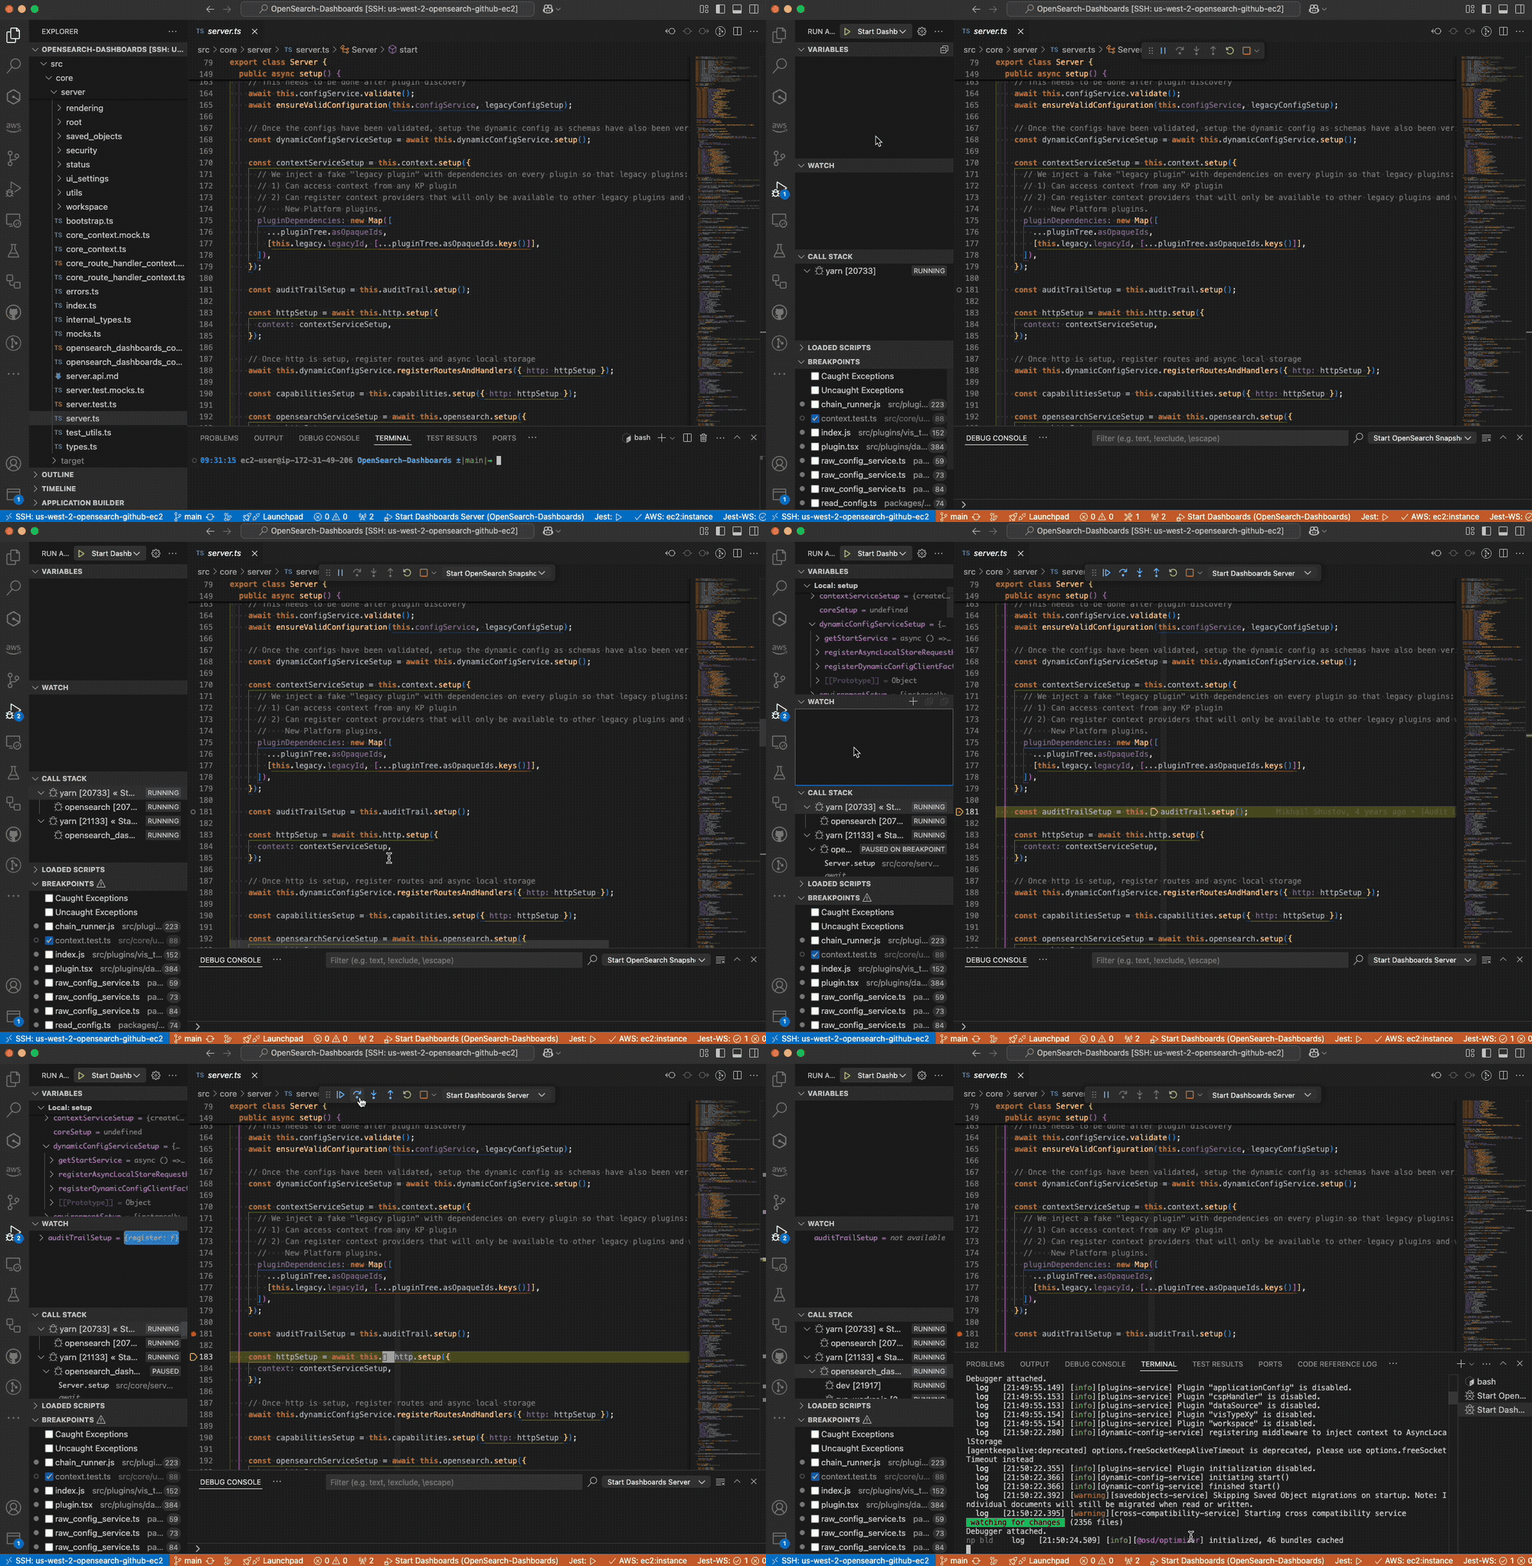
The run configuration is presented in the following image.
Prerequisites
Make sure NVM and Node 18.9.0 are installed on your system:
# With Homebrew
brew install nvm

# Normal
/bin/bash -c "$(curl -fsSL https://raw.githubusercontent.com/Homebrew/install/HEAD/install.sh)"

# Install 18.9.0
nvm install 18.9.0
Setup
-
If the
launch.jsonfile does not already exist in the.vscodedirectory at the project root, create it and add the following configuration:{ "version": "0.2.0", "configurations": [ /** * This starts the Dashboards server * - Will wait 13 seconds before starting so OpenSearch server can run */ { "name": "Start Dashboards Server", "type": "node", "request": "launch", // Alternatively, run "which yarn" and change the path of yarn "program": "~/.nvm/versions/node/v18.19.0/bin/yarn", "args": ["run", "start", "--no-base-path"], "cwd": "${workspaceFolder}", "runtimeExecutable": null, "runtimeArgs": [], "env": { "NODE_ENV": "development" }, "console": "integratedTerminal", "internalConsoleOptions": "openOnSessionStart", "preLaunchTask": "13 Second Delay Command" }, /** * This starts the OpenSearch snapshot server * - This will be ran first * - Everytime the server is stopped, data will NOT be persisted. Thus, if you need to persist data, you can configure this to run your own local OpenSearch server */ { "name": "Start OpenSearch Snapshot", "type": "node", "request": "launch", // Alternatively, run "which yarn" and change the path of yarn "program": "~/.nvm/versions/node/v18.19.0/bin/yarn", "args": ["run", "opensearch", "snapshot"], "cwd": "${workspaceFolder}", "runtimeExecutable": null, "runtimeArgs": [], "env": { "NODE_ENV": "development" }, "console": "integratedTerminal", "internalConsoleOptions": "openOnSessionStart" } ], "compounds": [ /** * This is the run configuration to startup OSD * 1. Starts up OpenSearch server * 2. Waits 13 seconds * 3. Starts up Dashboards server */ { "name": "Start Dashboards", "configurations": ["Start OpenSearch Snapshot", "Start Dashboards Server"], // If either Dashboards or OpenSearch server is stopped, both servers will be stopped (set this to false to individually turn off a server without turning all off) "stopAll": true } ] } -
If the
tasks.jsonfile does not already exist in the.vscodedirectory at the project root, create it and add the following configuration:{ "version": "2.0.0", "tasks": [ // Silent task to sleep for 13 seconds; this is the upper limit on the time taken for OpenSearch to boot up { "label": "13 Second Delay Command", "type": "shell", "command": "sleep 13", "group": "none", "presentation": { "reveal": "silent", "panel": "new", "close": true } } ] } -
On the Run and Debug tab, select Start Dashboards from the dropdown menu and press the play icon. OSD should start after a period of time.
Now you can set any breakpoint in server code.
The Debug toolbar should appear under the CALL STACK in a specific worker node, as shown in the following image.

Using this toolbar, you can resume breakpoints, step into code, and execute the next instruction.
Configuring multi-root workspace integration
For most development scenarios, working within the OSD Core should be sufficient. However, if you need to develop code for a plugin, the multi-root workspaces feature is a useful option. The setup for Jest, linting, and run configurations for plugins is similar to that of the OSD Core, so we won’t cover it in detail here.
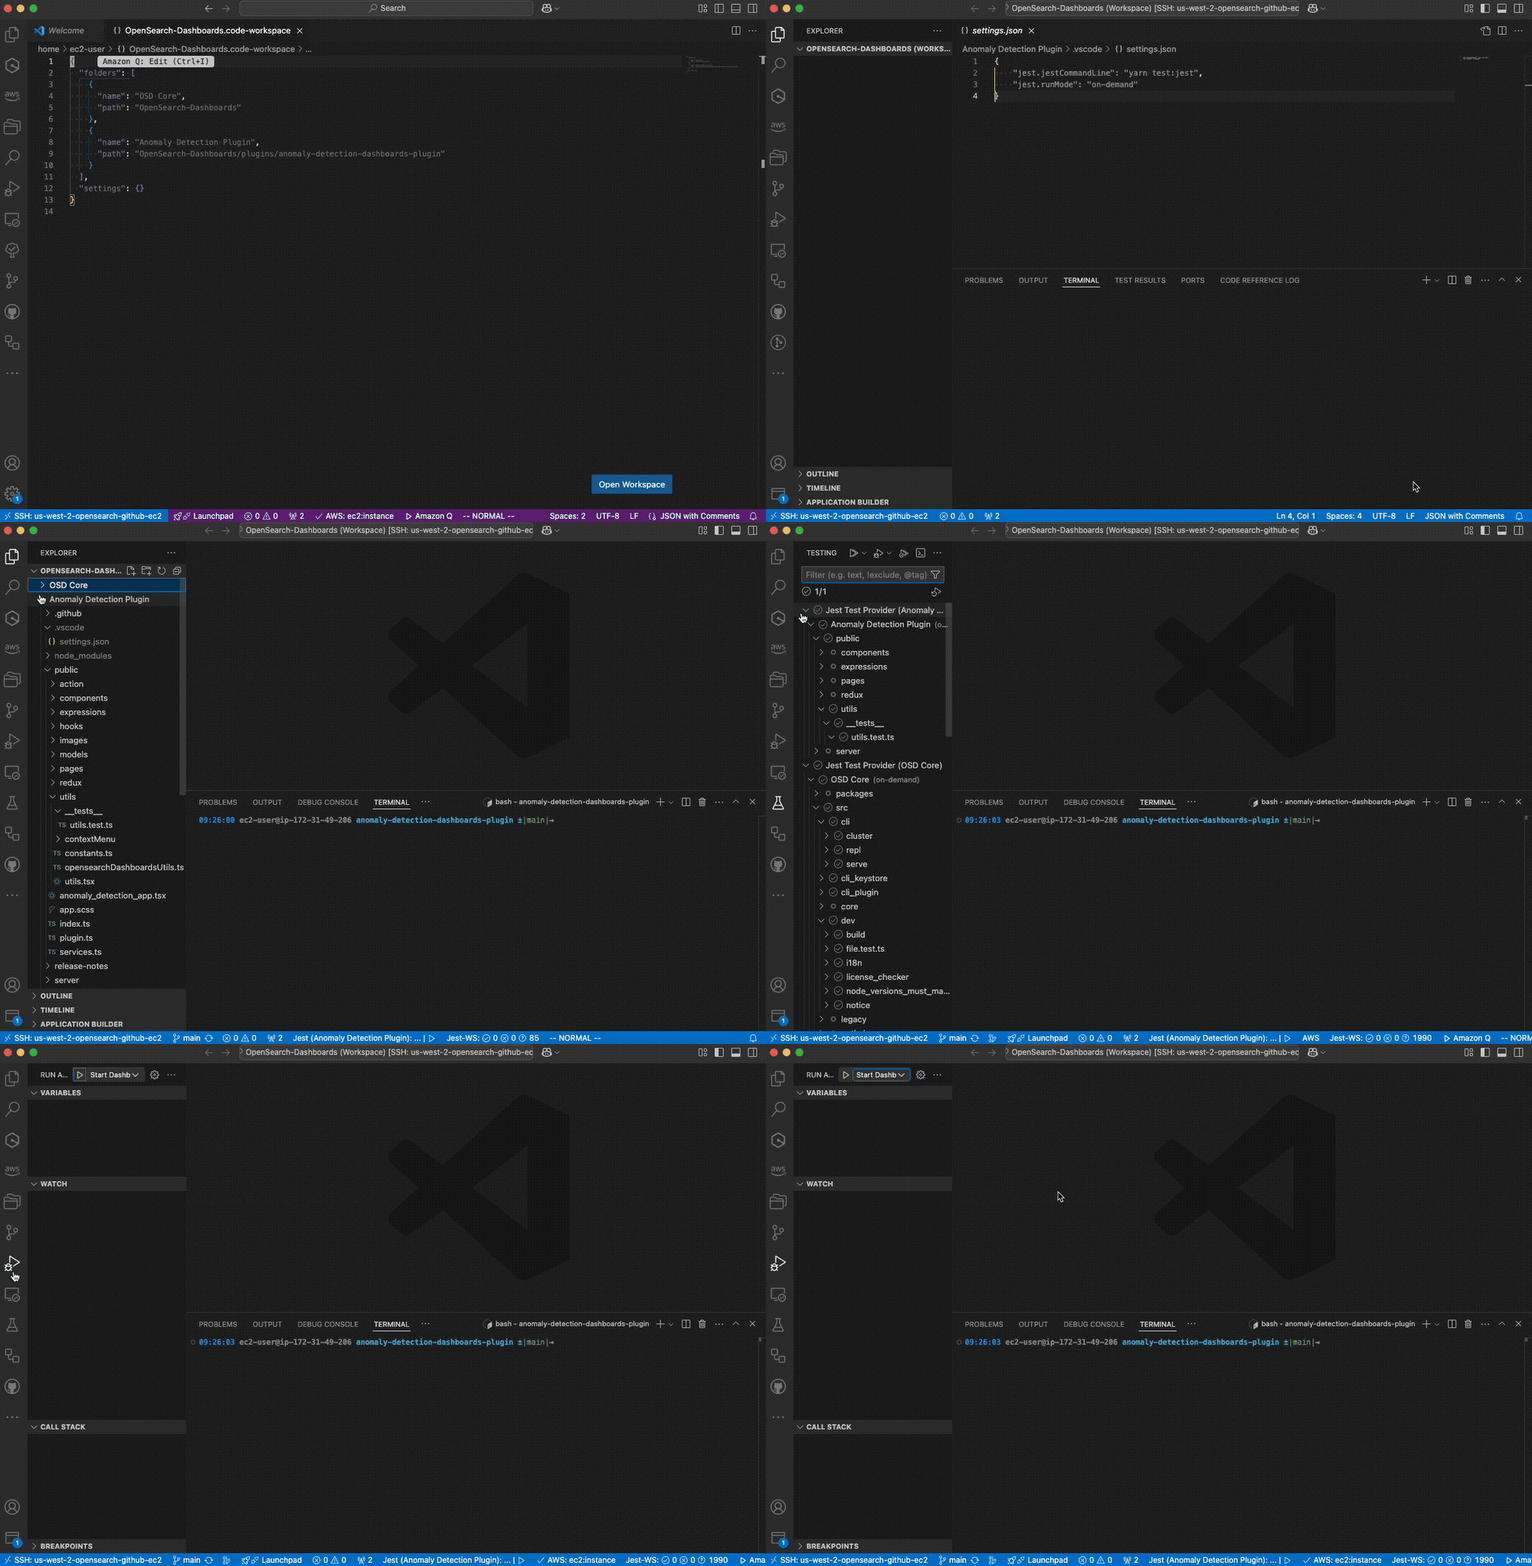
In summary, in order for OSD to recognize plugins during development, the plugin’s project root must be located within the OpenSearch-Dashboards/plugins/ directory. The following image shows multi-root workspace integration.
Setup
In this example, assume you’re developing code for the anomaly-detection-dashboards-plugin and that the project has been checked out in the plugins directory.
-
Navigate to one directory above the
OpenSearch-Dashboardsproject folder and create a file calledOpenSearch-Dashboards.code-workspace. Add the following configuration to this file:{ "folders": [ { // Names are configurable; they will show up in the EXPLORER tab "name": "OSD Core", // Path to the project root "path": "OpenSearch-Dashboards" }, { "name": "Anomaly Detection Plugin", "path": "OpenSearch-Dashboards/plugins/anomaly-detection-dashboards-plugin" } ], // Define workspace-specific settings here "settings": {}, "launch": { // Specify workspace-specific launch configurations "configurations": [], // Specify workspace-specific launch compounds "compounds": [] } } -
Select the Open Workspace button to view your new workspace.
In this workspace, you will have access to launch configurations, Jest test suites, code search, file search, and many other features.
Wrapping up
While these tools aren’t a replacement for a thorough understanding of the OSD codebase, they can help to streamline your development workflow. By automating tasks like server startup, debugging, and linting, they reduce time spent on configuration and allow you to focus on writing code. These tools make the development and PR process more efficient, saving you time and boosting productivity.
