


Visualizing data from multiple data sources with TSVB and Vega
Introduction
The multiple data sources feature gives users the capability to visualize data from various OpenSearch clusters. To date, only certain visualization types have been available. With the release of OpenSearch Dashboards 2.13 and 2.14, the multiple data sources feature is now compatible with Vega and Time-Series Visual Builder (TSVB) visualization types.
Read on to learn how you can visualize your data from multiple data sources using these visualization types with OpenSearch Dashboards.
What are TSVB and Vega?
TSVB is a data visualization tool for creating detailed time-series visualizations. Its key feature is the ability to add annotations or markers at specific time points based on index data, enabling associations between multiple indexes. In addition to time-series visualizations, TSVB offers area, line, metric, gauge, markdown, and data table panels. As of OpenSearch Dashboards version 2.14, users can choose the data source for their visualizations.
Vega and Vega-Lite are open-source, declarative visualization tools for creating custom data visualizations using OpenSearch data and Vega data. These tools are suitable for advanced users comfortable with writing OpenSearch queries directly. As of OpenSearch Dashboards version 2.13, users can specify a data_source_name for each OpenSearch query.
Creating TSVB visualizations from multiple data sources
Before proceeding, ensure that the following configurations are enabled in your opensearch_dashboards.yml file:
data_source.enabled: true
vis_type_timeseries.enabled: true
Step 1: Set up and connect data sources
Open OpenSearch Dashboards and follow these steps:
- Select Dashboards Management from the menu on the left.
- Select Data sources and then select the Create data source button.
- From the Create data source page, enter the connection details and endpoint URL, as shown in the following GIF.
- From the Home page, select Add sample data. Under Data source, select your newly created data source, and then select the Add data button for the Sample web logs dataset, as shown in the following GIF.
 Now that you have completed the setup, you can start visualizing your data.
Step 2: Create the visualization
Follow these steps to create the visualization:
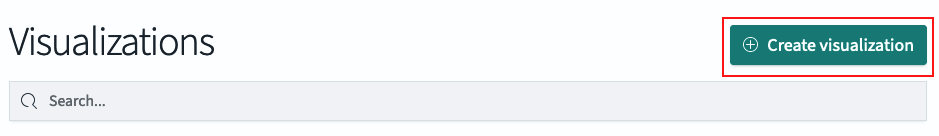
- From the menu on the left, select Visualize.
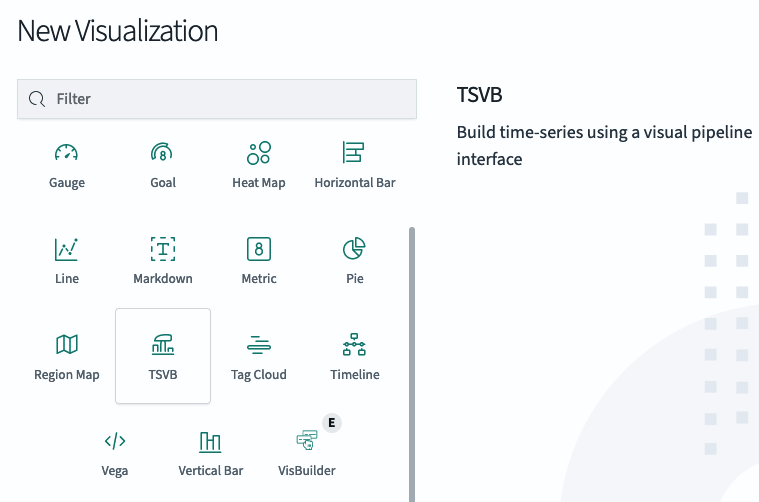
- From the Visualizations page, select Create Visualization and then select TSVB in the pop-up window, as shown in the following images.
- Proceed with specifying your data source.
Step 3: Specify your data
After creating a TSVB visualization, data may appear based on your default index pattern. To change the index pattern or configure additional settings, follow these steps to customize your visualization:
- Select Panel options.
- Under Data source, select the OpenSearch cluster from which to pull data. In this case, choose your newly created data source.
- Under Index name, enter
opensearch_dashboards_sample_data_logs. - Under Time field, select
@timestamp. This setting specifies the time range for rendering the visualization.
The following GIF shows these steps in action.
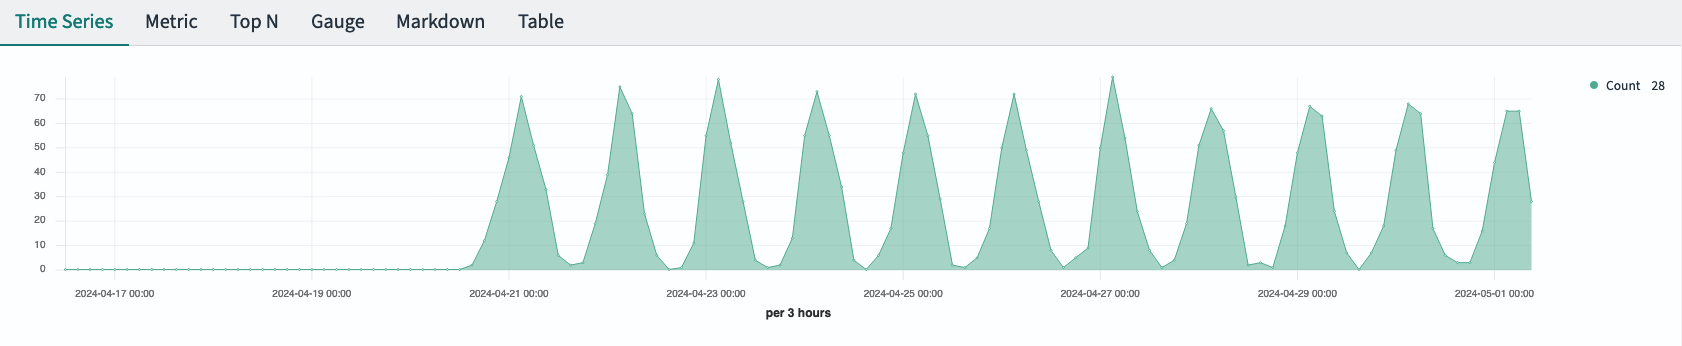
 The following image shows the TSVB visualization output.
Step 4: Add annotations
Annotations allow you to place markers on your time-series visualization data. Follow these steps to annotate your visualization:
- On the upper-left of the page, select Time Series.
- Select the Annotations tab and then Add data source.
- In the Index name field, specify the appropriate index. In this case, continue using the same index from the previous steps, that is,
opensearch_dashboards_sample_data_logs. - Under Time field, select
@timestamp. - In Fields, enter
timestamp. - In Row template, enter
timestamp.
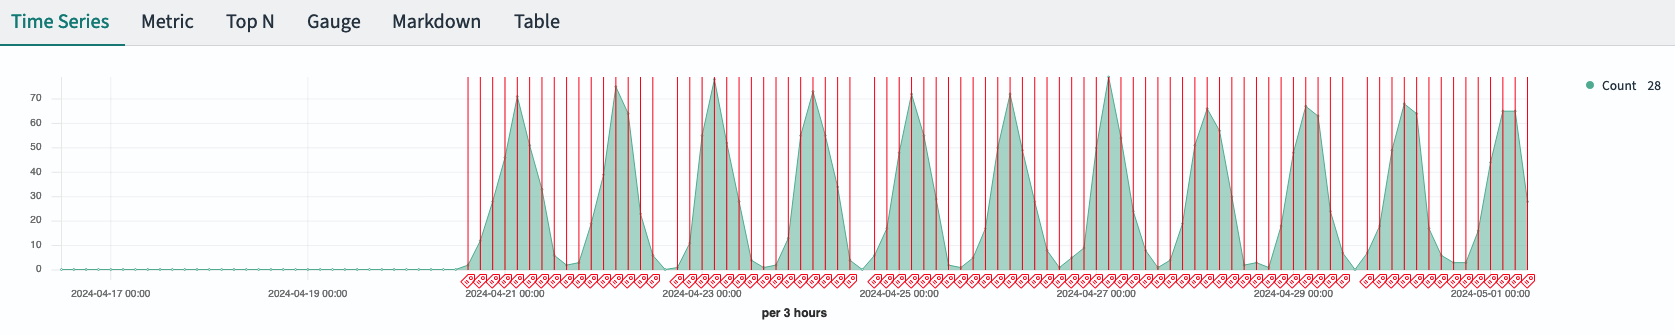
The visualization automatically updates to display your annotations, as shown in the following image.
Creating Vega visualizations from multiple data sources
Before proceeding, ensure that the following configurations are enabled in your opensearch_dashboards.yml file:
data_source.enabled: true
vis_type_vega.enabled: true
Step 1: Set up and connect data sources
Open OpenSearch Dashboards and follow these steps:
- Select Dashboards Management from the menu on the left.
- Select Data sources and then select the Create data source button.
- From the Create data source page, enter the connection details and endpoint URL, as shown in the following GIF.
- From the Home page, select Add sample data. Under Data source, select your newly created data source, and then select the Add data button for the Sample web logs dataset, as shown in the following GIF.
Now that you have completed the setup, you can start visualizing your data.
Step 2: Create the visualization
- From the menu on the left, select Visualize.
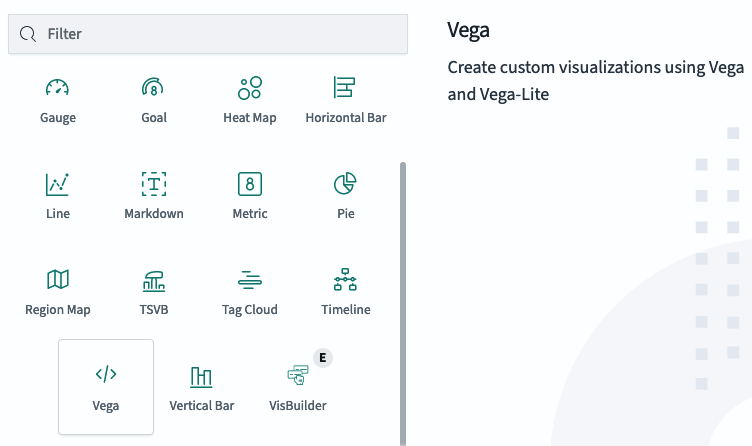
- From the Visualizations page, select Create Visualization and then select Vega from the pop-up window, as shown in the following images.
Step 3: Add the Vega specification
- Verify that the data source you created is specified under
data_source_name. - Copy the following Vega specification:
{
  $schema: https://vega.github.io/schema/vega-lite/v5.json
  data: {
    url: {
      %context%: true
      %timefield%: @timestamp
      index: opensearch_dashboards_sample_data_logs
      data_source_name: YOUR_DATA_SOURCE_TITLE
      body: {
        aggs: {
          1: {
            date_histogram: {
              field: @timestamp
              fixed_interval: 3h
              time_zone: America/Los_Angeles
              min_doc_count: 1
            }
            aggs: {
              2: {
                avg: {
                  field: bytes
                }
              }
            }
          }
        }
        size: 0
      }
    }
    format: {
      property: aggregations.1.buckets
    }
  }
  transform: [
    {
      calculate: datum.key
      as: timestamp
    }
    {
      calculate: datum[2].value
      as: bytes
    }
  ]
  layer: [
    {
      mark: {
        type: line
      }
    }
    {
      mark: {
        type: circle
        tooltip: true
      }
    }
  ]
  encoding: {
    x: {
      field: timestamp
      type: temporal
      axis: {
        title: @timestamp
      }
    }
    y: {
      field: bytes
      type: quantitative
      axis: {
        title: Average bytes
      }
    }
    color: {
      datum: Average bytes
      type: nominal
    }
  }
}
- Select the Update button in the lower-right corner to visualize your data, as shown in the following GIF.

Conclusion
In this blog post, we showed you how to create TSVB and Vega visualizations from multiple data sources. Creating visualizations for your data has never been more versatile! Connect with the OpenSearch Project multiple data sources team to give feedback about how this capability is working for you. You can reach the team at https://forum.opensearch.org/t/feedback-multiple-data-sources-support-for-tsvb-and-vega/19598.