OpenSearch 2.5 is live!
OpenSearch 2.5.0 is ready for download! This year’s first release focuses on investments in core functionality, including new and improved ways to administer your clusters as well as tools for accessing, managing, and visualizing your data. Many of these features are building blocks, introducing functionality that the project can continue to expand upon throughout 2023 and beyond. Also included are updates to existing tools, such as the ability to analyze traces using data stored in the Jaeger schema and the general availability of Security Analytics. As you put this release to work, we hope you’ll share your feedback and help shape what these features can offer the community. As always, you can explore OpenSearch Dashboards without downloading software on the Playground.
Simplify cluster operations with index management UI enhancements
Previously, users relied on REST APIs or YML configurations for basic administrative operations and interventions. This release takes the first step toward a unified administration panel in OpenSearch Dashboards with the launch of several index management UI enhancements. The new interface provides a more user-friendly way to run common indexing and data stream operations. Now you can perform create, read, update, and delete (CRUD) and mapping for indexes, index templates, and aliases through the UI as well as open, close, reindex, shrink, and split indexes. The UI runs index status and data validation before submitting requests and lets you compare changes with previously saved settings before making updates.
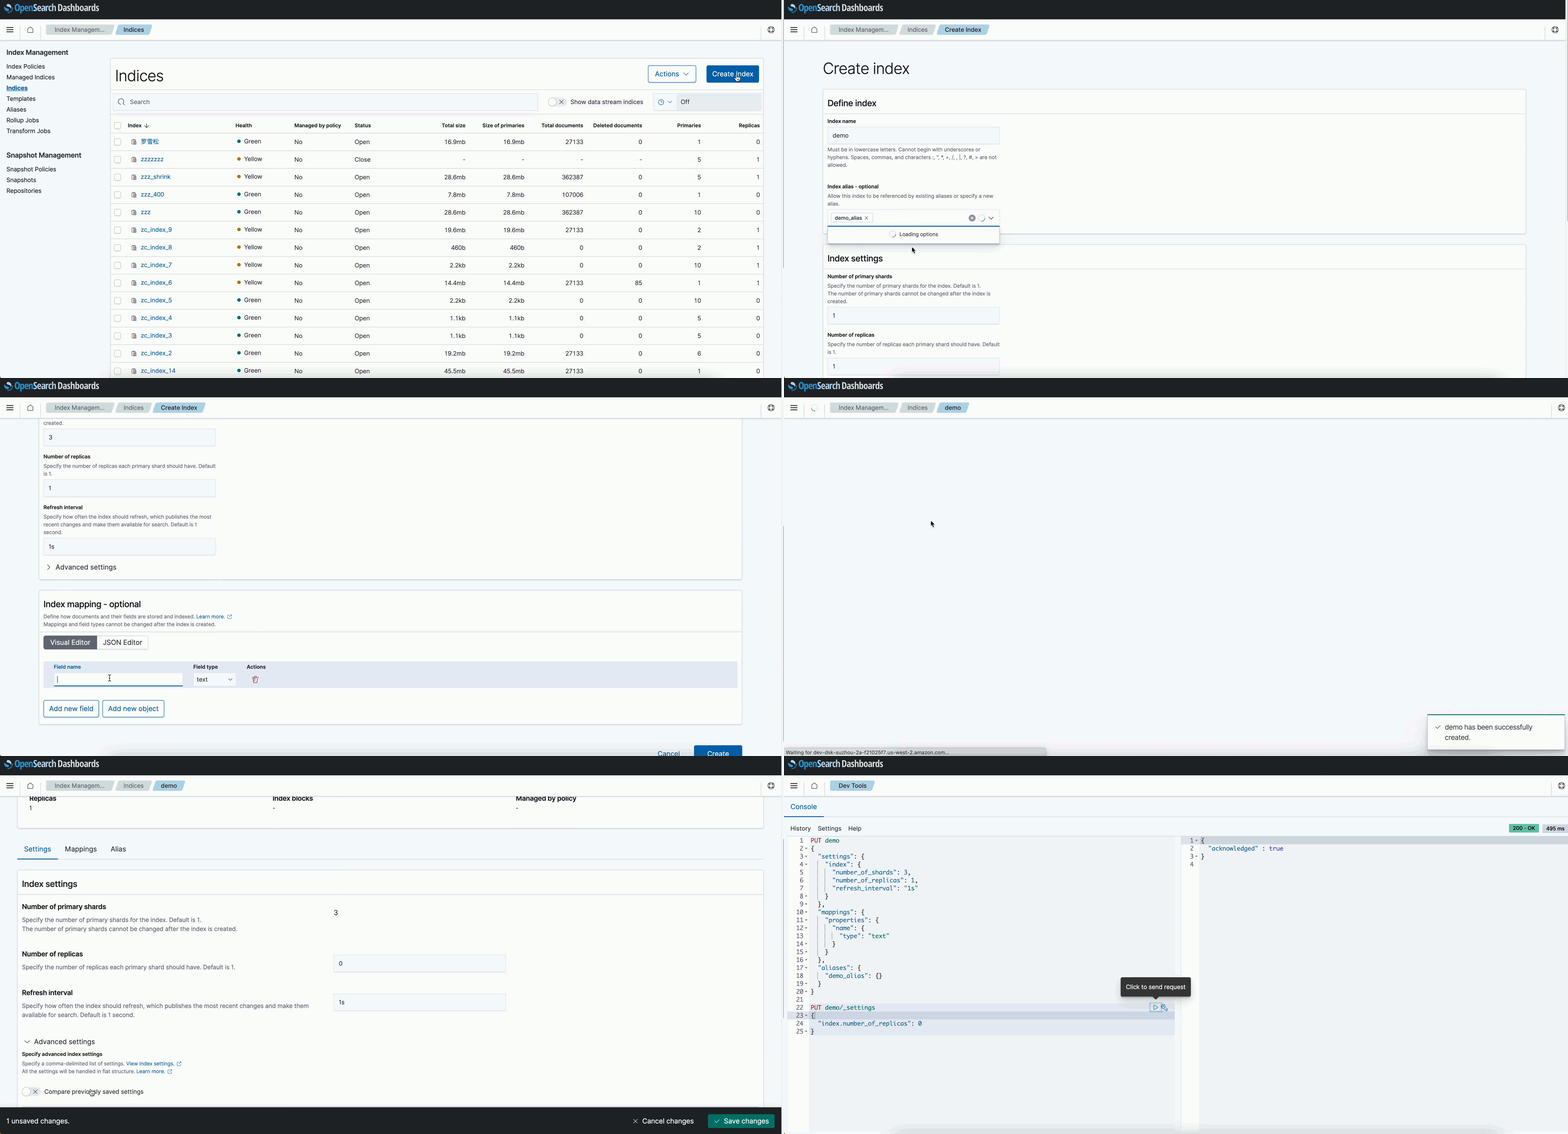
We believe this will boost usability for cluster administrators, particularly those who may be new to the tools or less familiar with REST and YML configurations. In the future, you can expect the project to add a lot more UI functionality as we move toward a unified administration panel that addresses cluster configuration, monitoring, management, and more. We appreciate your feedback on areas to prioritize as the UI is expanded.
Analyze Jaeger trace data with OpenSearch Dashboards
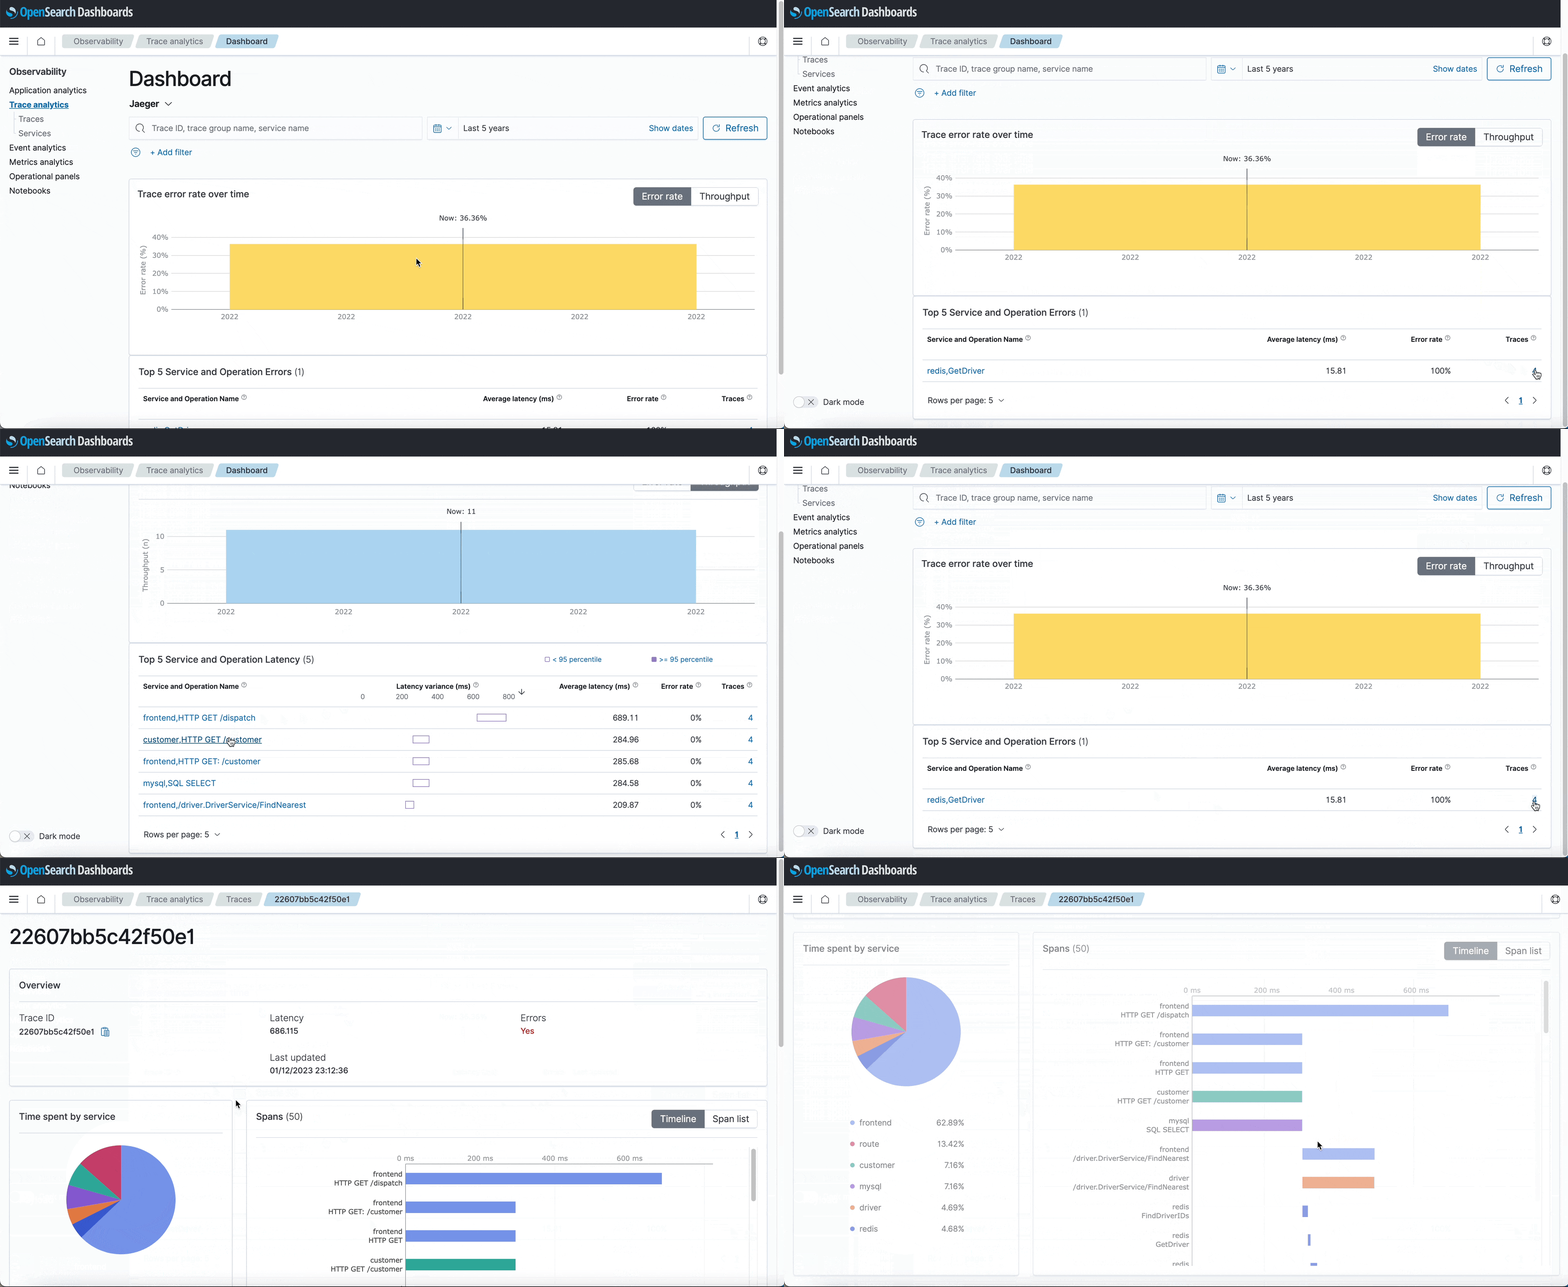
Now OpenSearch Dashboards users can analyze trace data collected by the widely adopted open-source Jaeger tools. OpenSearch Dashboards Observability now allows you to analyze traces using Jaeger data stored in OpenSearch, with the option to select Data Prepper or Jaeger as the source of your trace data within the same UI. If you currently store your Jaeger trace data in OpenSearch, you can now use Trace Analytics to analyze error rates and latencies. You can also filter traces and examine the span details of a trace to pinpoint any service issues. To learn more, see Analyze Jaeger trace data in the OpenSearch documentation.
Build layered maps with multiple sources
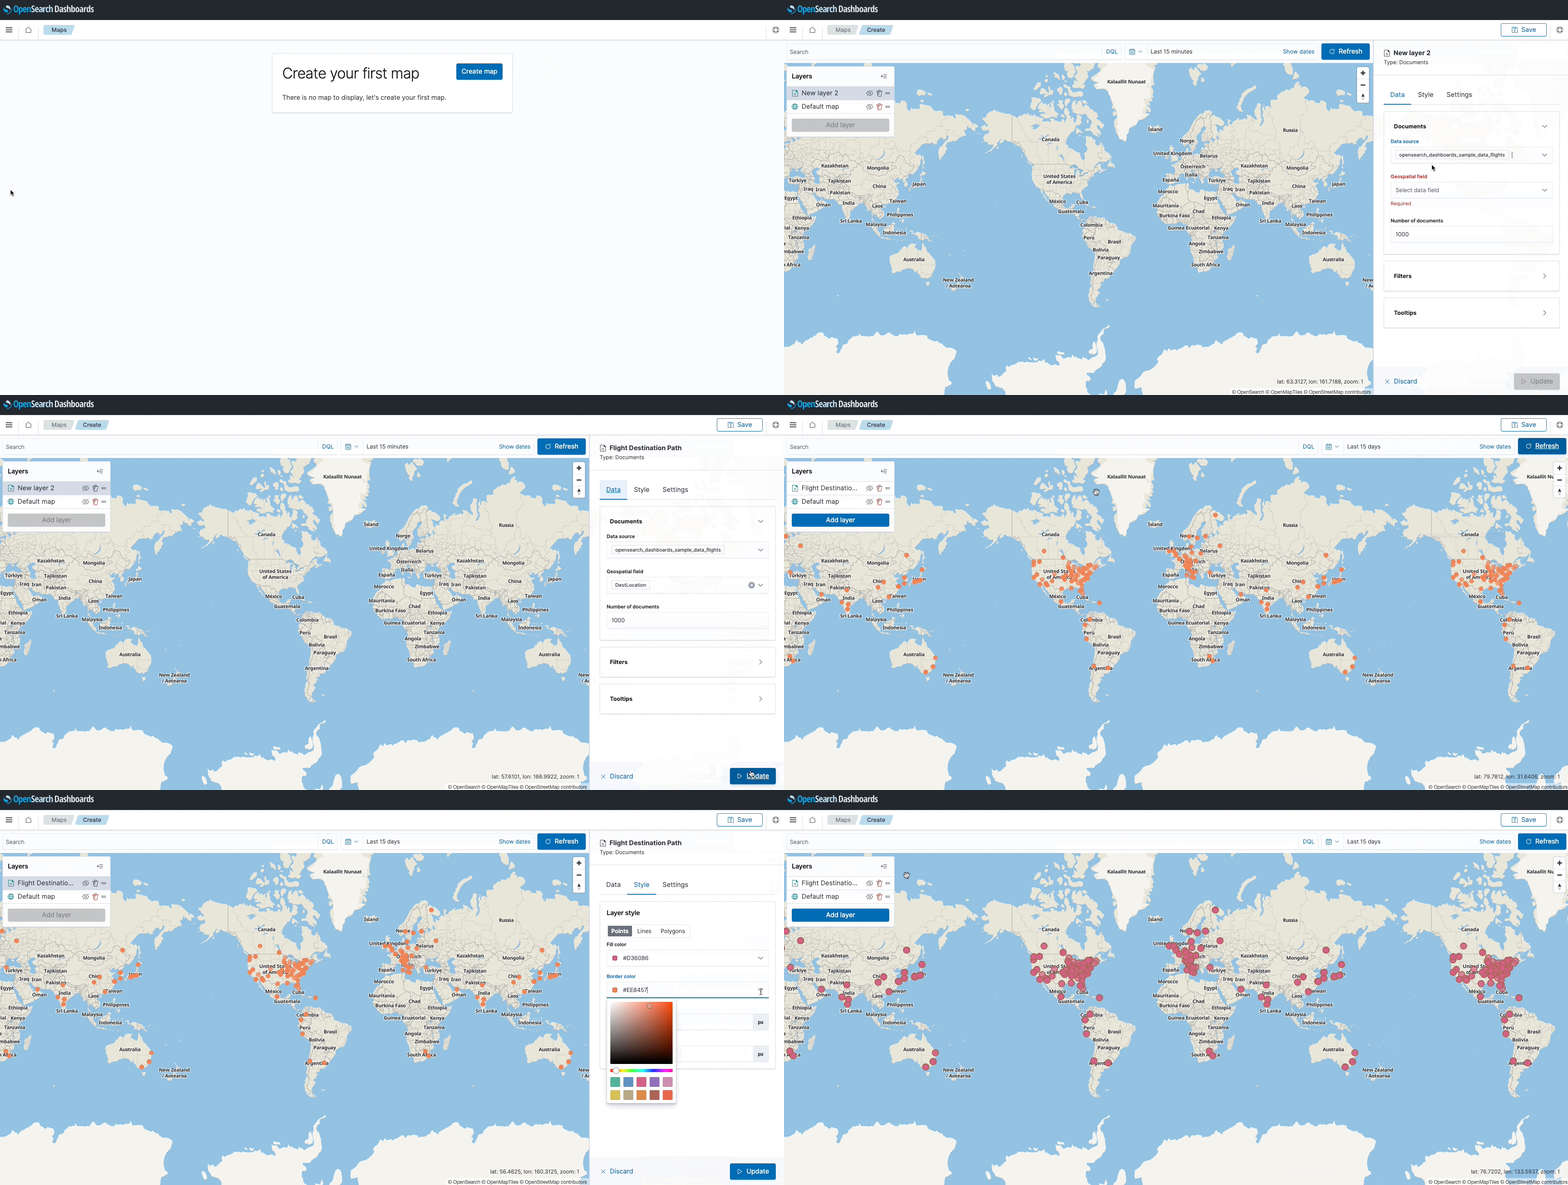
In previous versions of OpenSearch Dashboards, maps were limited to one data source comprising a single layer from which the map could be built. Now you can build multi-layered maps using raw data from multiple sources and interact with layered maps to gain new insights. This functionality lets you combine data from different indexes into a single visualization, add and remove layers to spot correlations, view different data at different zoom levels, and more. This, in turn, will help map builders and other analysts uncover new ways to ask and answer questions about their geospatial data using these tools.
Deploy directly to Debian environments
Some users of Debian-based Linux distributions like Ubuntu have been asking for a Debian distribution of OpenSearch. As of this release, those users can now deploy OpenSearch and OpenSearch Dashboards directly to their Debian servers with the project’s first Debian distribution. You’ll find step-by-step installation instructions in the OpenSearch documentation. We would especially like to acknowledge the OpenSearch community, including project partner Graylog, for their significant contributions to building this distribution.
Deploy remote-backed storage on a per-index basis
This release builds on the experimental remote-backed storage capabilities introduced in OpenSearch 2.3 with request-level durability for remote-backed indexes. This feature lets you deploy remote-backed storage on a per-index basis using Amazon Simple Storage Service (Amazon S3), Azure Blob Storage, Google Cloud Storage, or Oracle Cloud Infrastructure (OCI) Object Storage. We expect users will want to explore the increased data durability afforded by cloud-based backup and restore and welcome your feedback on how this works with your clusters. As a reminder, experimental features are recommended for use outside of production environments.
Enhancements to existing features
This release also includes a number of enhancements to existing features. For a comprehensive list of updates, check out the release notes.
- Introduced as an experimental feature in the 2.4.0 release, Security Analytics for OpenSearch and OpenSearch Dashboards is now generally available and ready for production workloads. With more than 2,000 prepackaged Sigma security rules and support for multiple log sources, including Windows, Netflow, DNS, AWS CloudTrail, and more, Security Analytics offers a range of tools to help you monitor and detect potential security threats before they can disrupt your operations.
- OpenSearch 2.4.0 introduced the model-serving framework, an experimental feature that lets users upload their own text-embedding machine learning (ML) models. OpenSearch 2.5.0 allows users to serve ML models on ML nodes that can take advantage of CUDA-compatible GPUs. This offers potential price-performance benefits and may reduce the inference latency of deep learning models that power semantic search queries.
- OpenSearch users use index rollups to compress older time-series data into summarized indexes, reducing data granularity and offering potential improvements in storage costs and performance. This release adds query string search queries to the range of query types you can use to search your rollup indexes and find the data you’re looking for.
- Previously, OpenSearch only showed administrators a health assessment for a cluster as a whole. This release gives users the option to view the health of their cluster at the awareness attribute level when shard allocation awareness is configured.
Getting started
You can download OpenSearch 2.5.0 here, and you can also explore OpenSearch Dashboards live on the Playground. To find out more about the release, see the release notes and the documentation release notes. To learn more about OpenSearch, see the OpenSearch documentation.
We look forward to seeing your thoughts on this release in the community forum!
