You can now see ML model status in OpenSearch Dashboards
Before OpenSearch 2.6, checking the status of a deployed machine learning (ML) model in OpenSearch could only be done by using the ML Commons Profile API. Although the Profile API returned data organized by ML nodes, the response could not tell you the status of a specific model deployed on an ML node.
The ML team is happy to announce the first piece of ML functionality in OpenSearch Dashboards, the deployed models dashboard, as an experimental feature. The deployed models dashboard gives you a view into the responsiveness of each deployed model on each ML node in your cluster.
Viewing deployed ML status at the model level
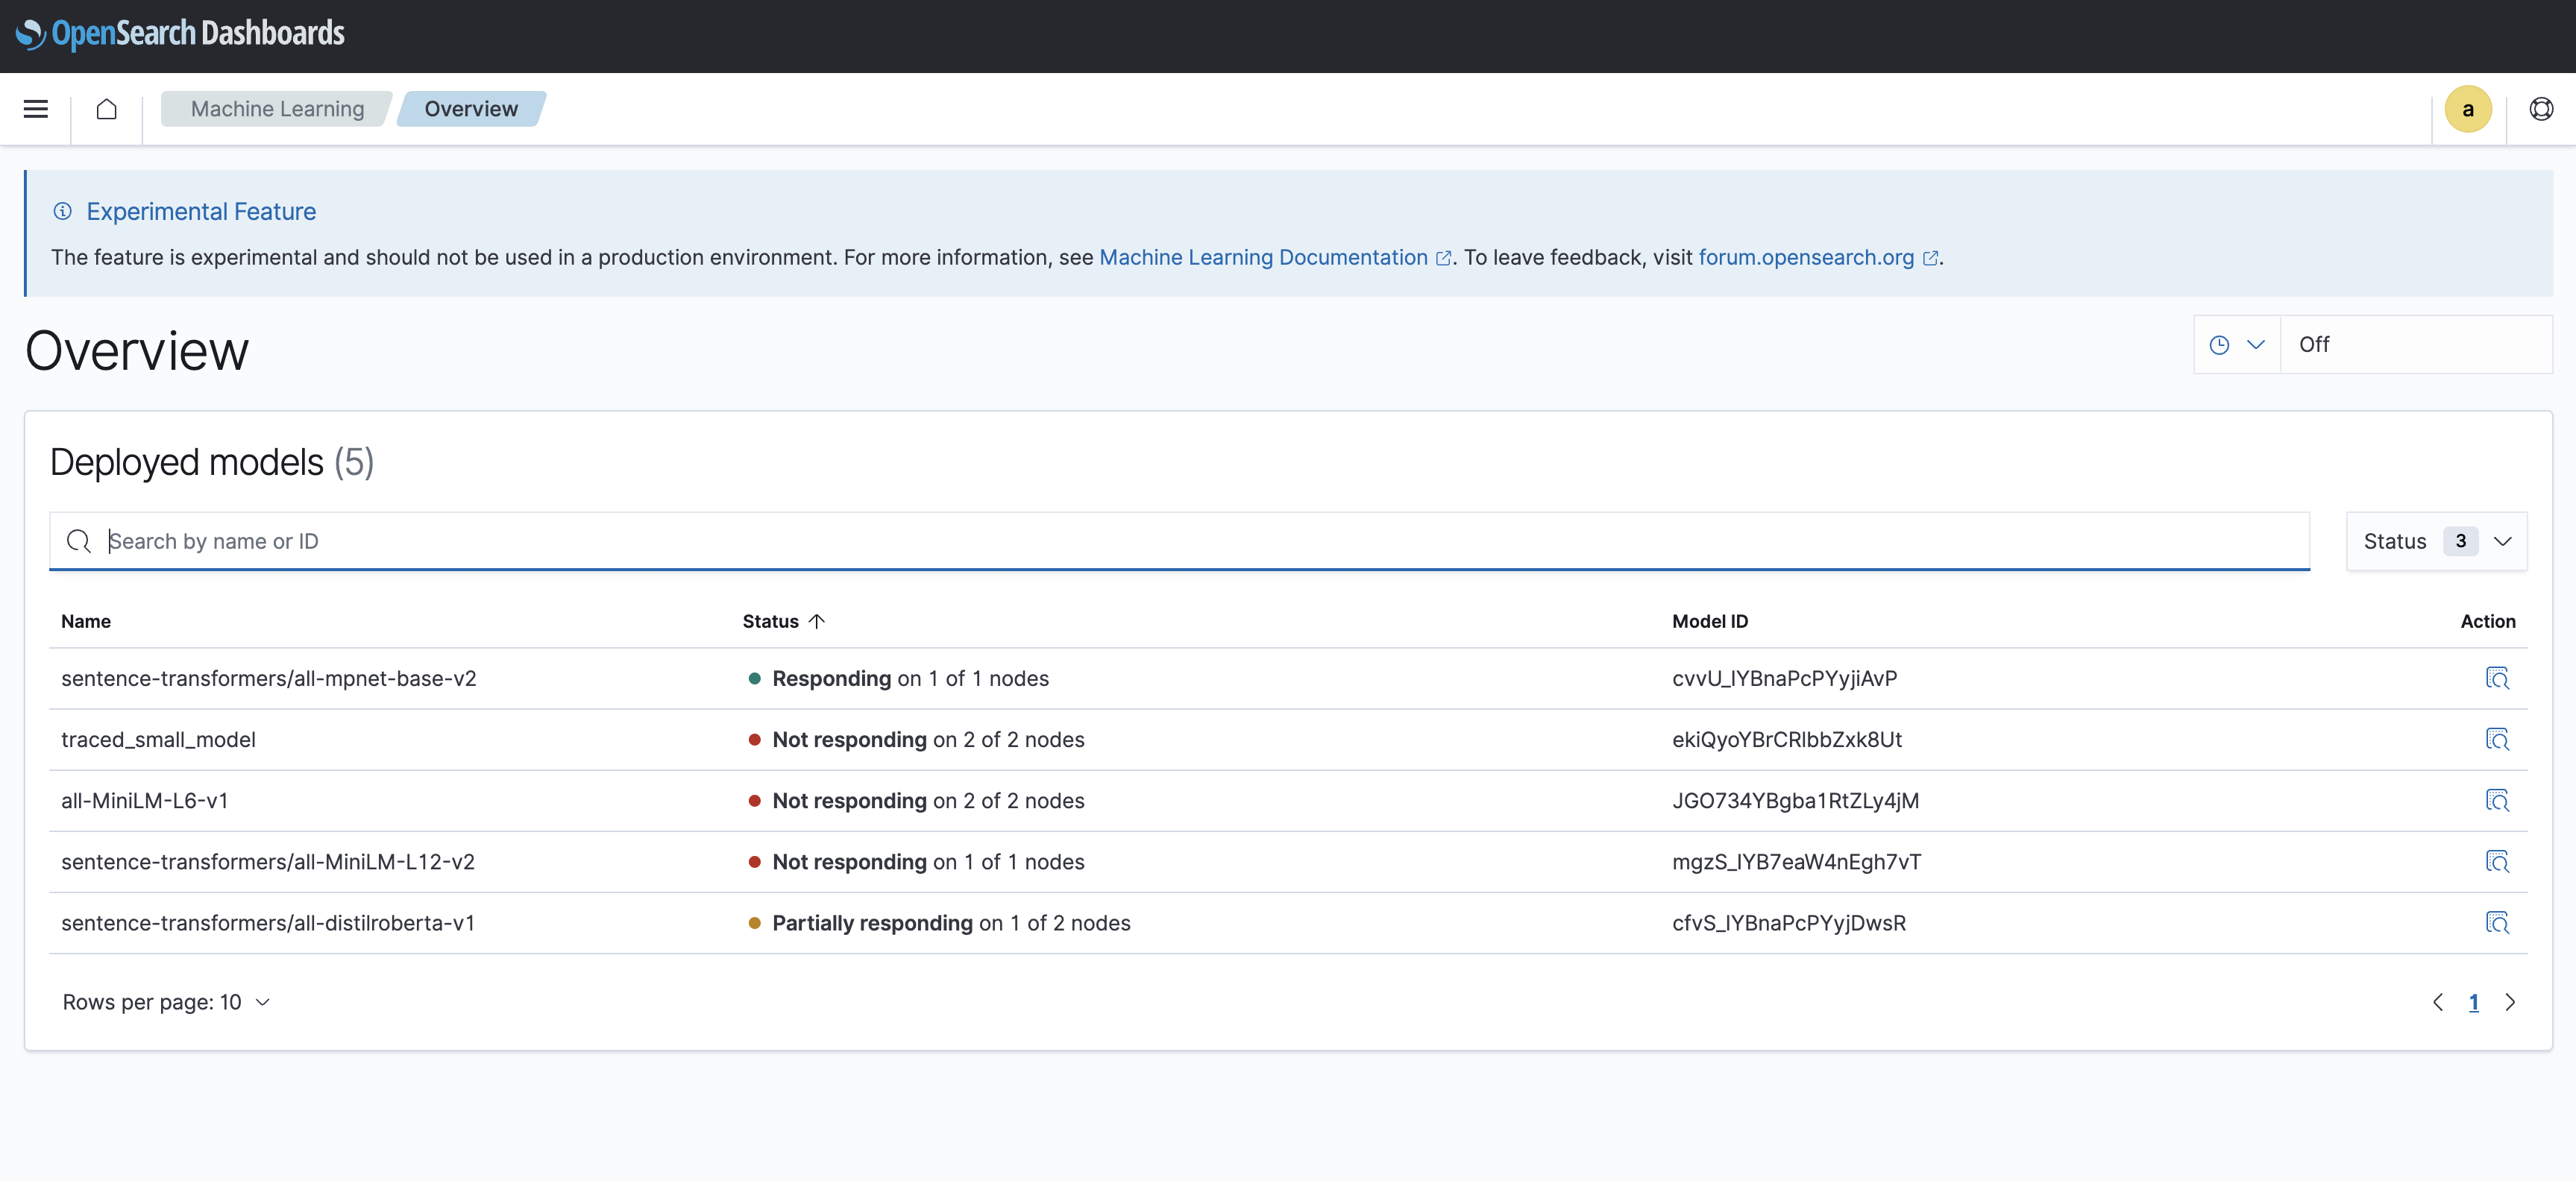
You can find the the deployed model dashboard in the Machine Learning section of OpenSearch Dashboards, as shown in the following image.

The deployed model dashboard shows the following information about your deployed models:
- Name: The name of the model given upon upload.
- Status: The number of nodes for which the model is responsive.
- When all nodes are responsive, the status is Green.
- When some nodes are responsive,the status is Yellow.
- When all nodes are unresponsive, the status is Red.
- Model ID: The model ID.
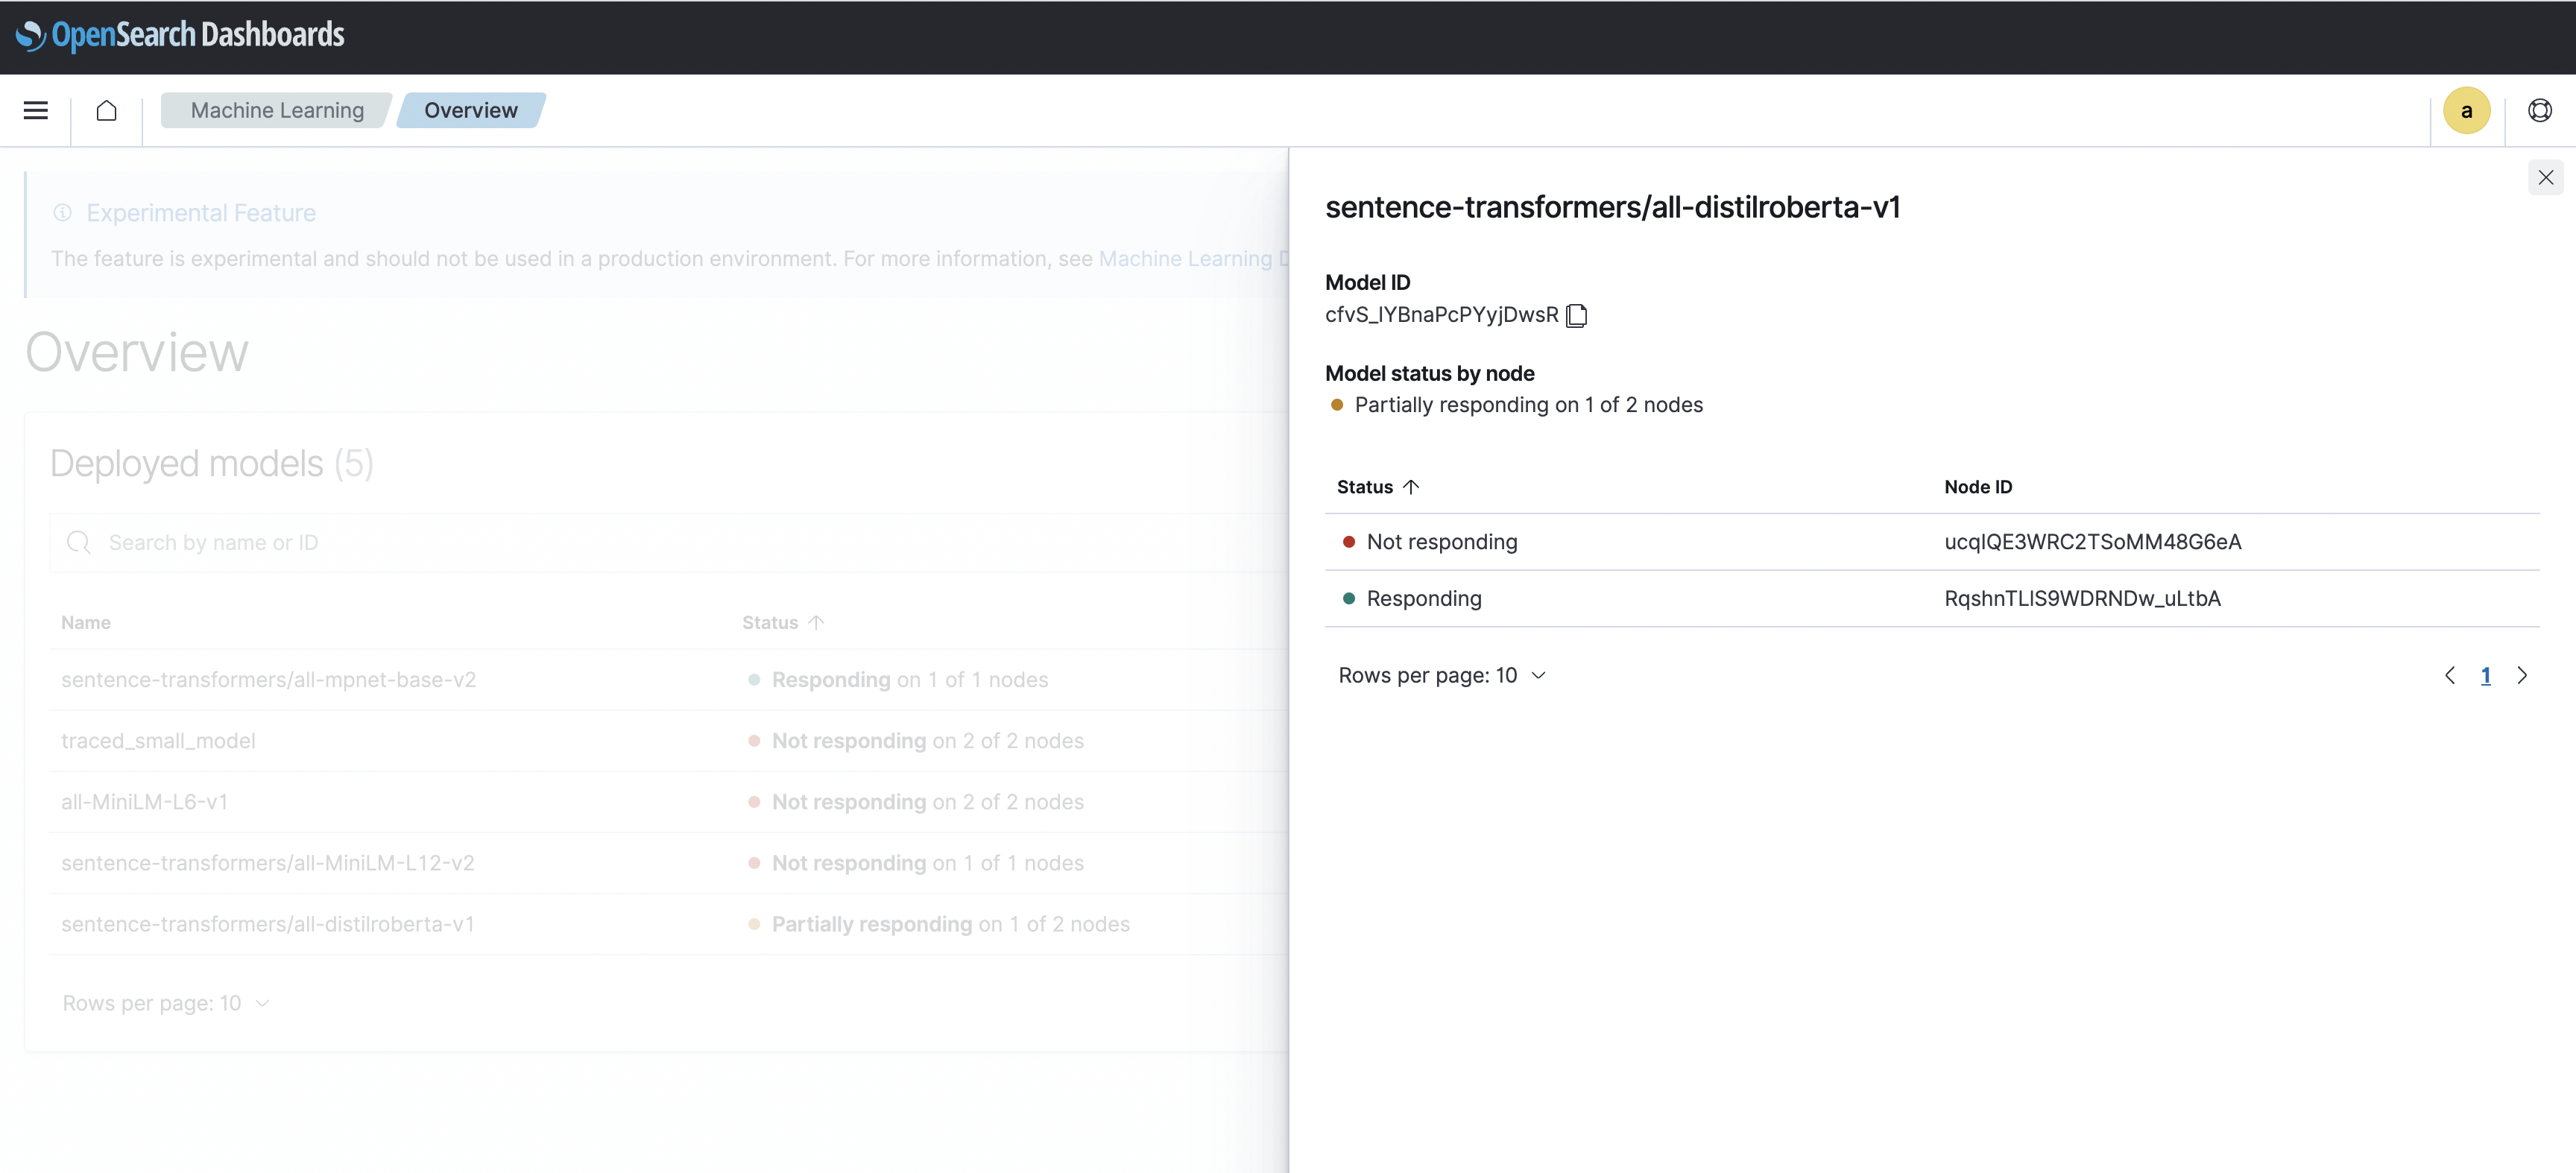
If you want to see even more details about your model’s responsiveness, select View status details to see a detailed view of your model on each of its ML nodes, as shown in the following image.

The detailed view prevents you from having to manually call the Profile API and parse through complex return results to see which ML nodes are responsive. Instead, the detailed view tells you which ML nodes, by Node ID, are responding or not responding, which is very useful when troubleshooting deployment issues.
Simplifying model filtering and searching
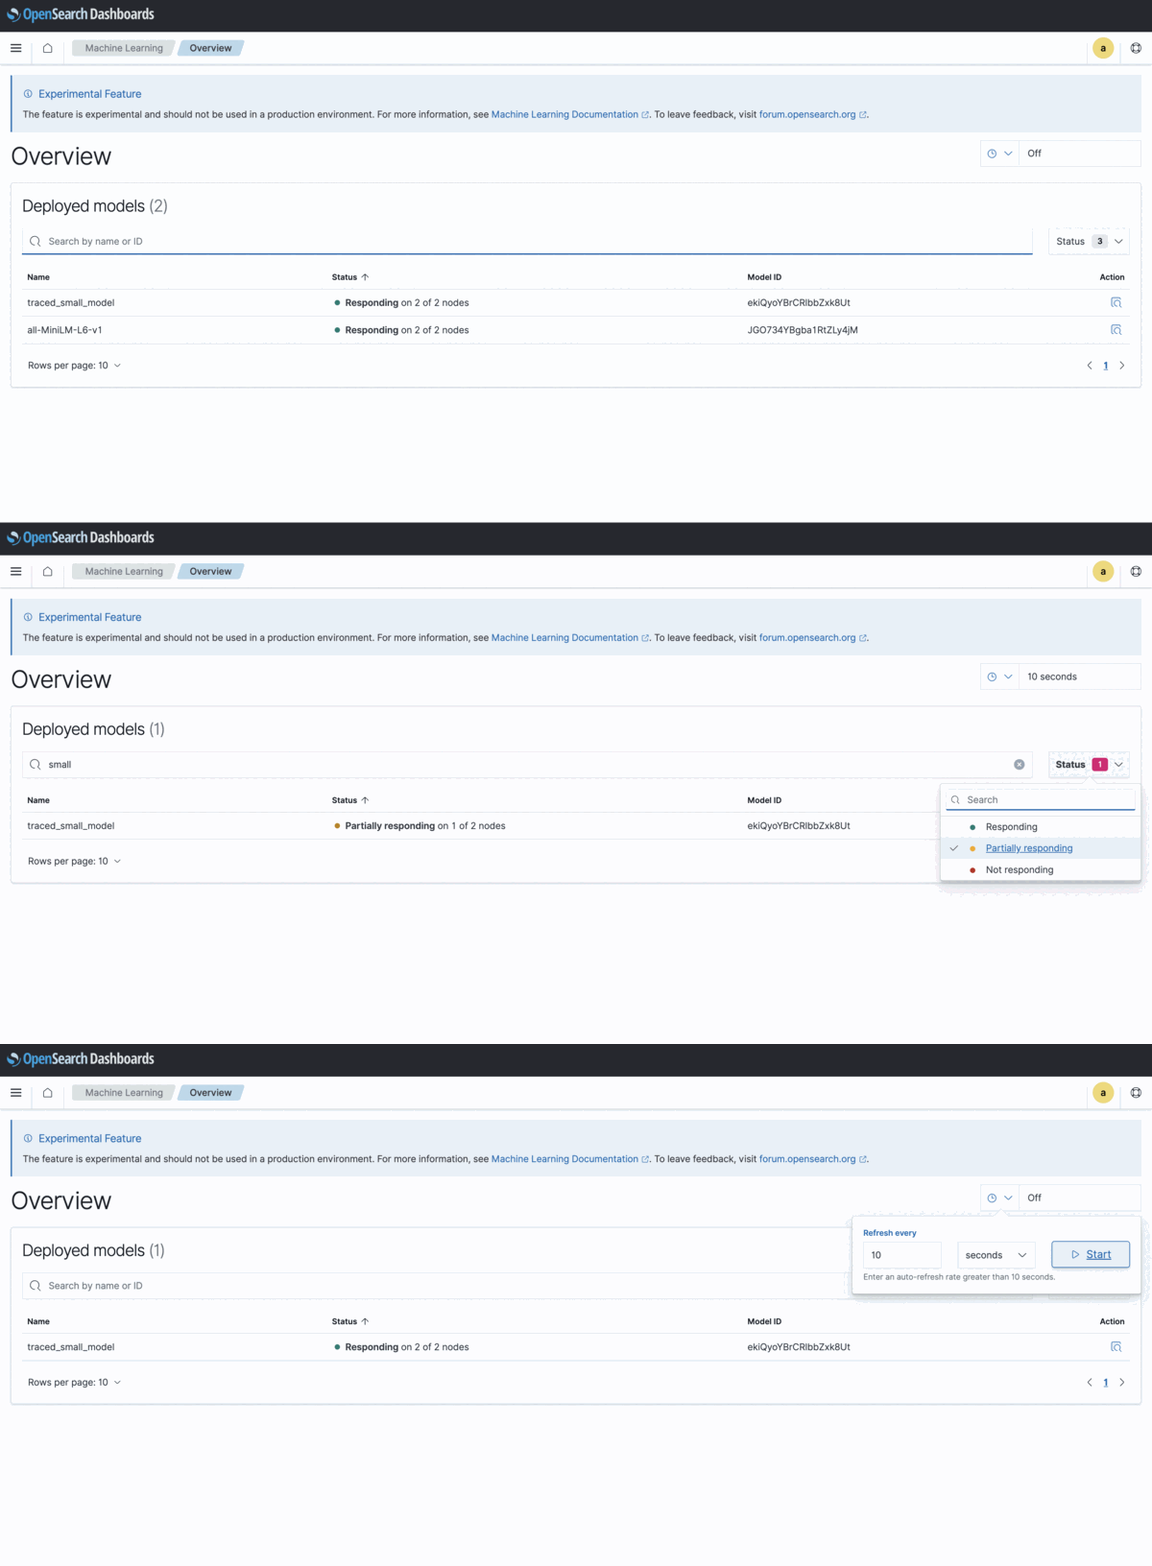
If you deploy a large number of models, you might find it difficult to locate the model you need with the Profile API. Luckily, you can search and filter through all deployed models by using:
- The model name.
- The model ID.
- The model status.
Furthermore, the deployed model dashboard can automatically refresh data according to a selected time cycle. To set the refresh cycle, select the Clock icon, set the refresh time, and then select Start, as shown in the following image.

Next steps
The ML functionality in OpenSearch Dashboards is experimental, so it shouldn’t be used in a production environment. If you want to test the functionality, see Enabling ML in Dashboards or visit the ML OpenSearch Dashboard Playground.
For additional updates on the deployed models dashboard or to leave feedback, see the OpenSearch Forum discussion.


