Introducing OpenSearch 2.6
OpenSearch 2.6.0 is now available, with a new data schema built to OpenTelemetry standards that unlocks an array of future capabilities for analytics and observability use cases. This release also delivers upgrades for index management, improves threat detection for security analytics workloads, and adds functionality for visualization tools, machine learning (ML) models, and more. Read on for an overview of the latest additions to the project and visit our downloads page to get started with the new distributions. You can always explore OpenSearch Dashboards on the Playground, with no need to download.
Unlock data sources with an OpenSearch simple schema
As OpenSearch continues to add functionality to power analytics and observability use cases, users and community partners have identified an opportunity to take a standardized approach to accessing metrics, traces, and unstructured data, such as logs, from different sources. To help address this, OpenSearch 2.6.0 introduces Simple Schema for Observability, providing a common, unified data schema for OpenSearch.
The schema supports a structured definition for major analytics and observability signals, including logs, traces, and metrics, conforming to OpenTelemetry standards. In version 2.6.0, the schema will showcase, as a proof of concept, out-of-the-box observability dashboards based on integrations with community contributors. The proof of concept incorporates Calyptia’s Fluent Bit tools using NGINX log data, with dashboard content provided by WorldTechIT, offering the community a way to explore the schema, provide feedback, and suggest types of dashboards for future development. You can explore this proof of concept today on the OpenSearch Playground, or you can use this tutorial to get started.
With the new schema, the community can build rich functionality, such as predefined dashboards and configurations, based on common standards and formats across the data pipeline. This is a key step toward enabling a range of capabilities for ingesting, extracting, and aggregating telemetry data and driving discoveries from monitored systems. We invite the community’s feedback in this request for comments.
Simplify cluster administration with index management tools
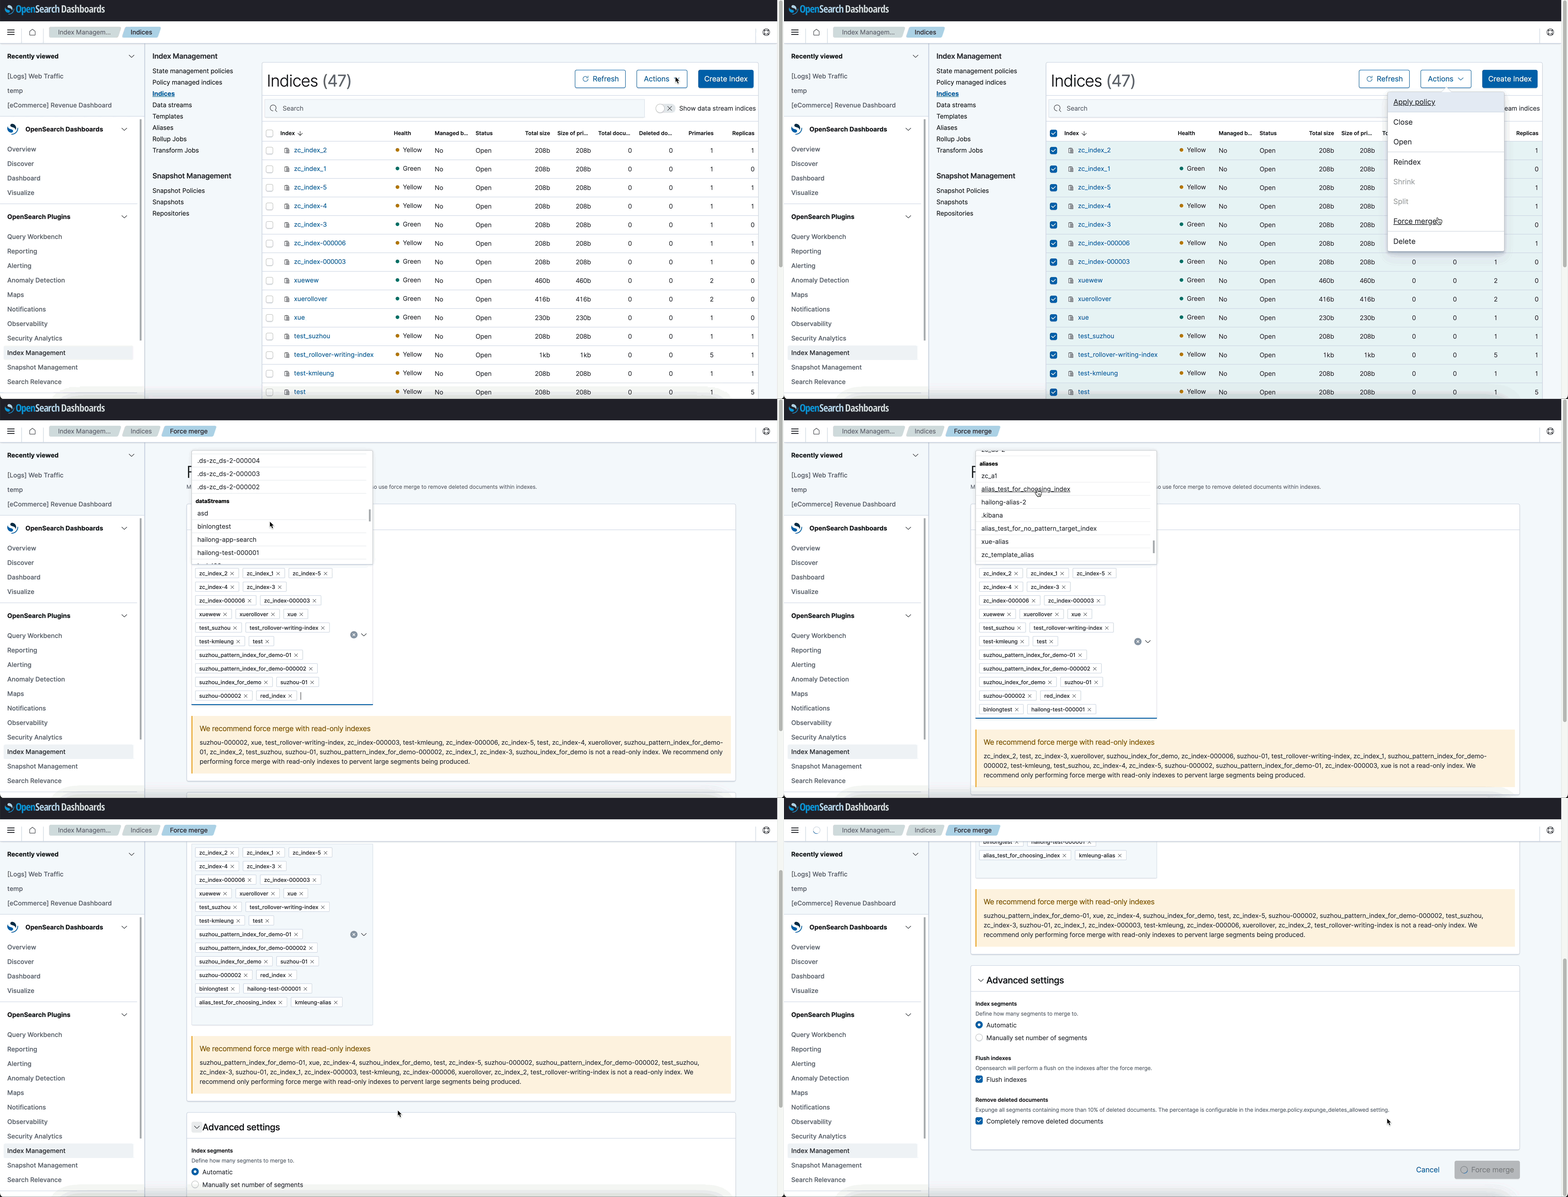
OpenSearch 2.6.0 adds functionality that simplifies cluster administration. Building on the index management UI introduced in the 2.5.0 release, this update allows you to create, view, and manage data streams directly from the UI. OpenSearch admins also gain the ability to perform manual rollover operations for indexes or data streams—as well as force merge indexes or streams—from the UI, helping you manage and maintain your OpenSearch clusters more efficiently.

Augment threat detection with Security Analytics
Security Analytics tools also received upgrades for threat detection in this release. When you create threat detectors in OpenSearch 2.6.0, you can now use multiple indexes or index patterns to build the detector, rather than just a single source. Five new log types are available for threat detection, bringing the total to 13. These new log types include Google Workspace logs, GitHub actions, Microsoft 365 logs, Okta events, and Microsoft Azure logs. In addition, many detector types now include out-of-the-box dashboards designed to visualize the logs they are monitoring. With one click, you can now view surrounding documents from the time at which a security finding was generated. This can help you identify broader patterns in your security logs.
View location and status of ML models
Version 2.6.0 includes a new ML model health dashboard as an experimental feature, allowing you to view the location and status of ML models within a cluster. Look for further development of the ML Commons UI in future releases to help simplify administration of semantic search deployments and other ML workloads.
Add maps to OpenSearch Dashboards
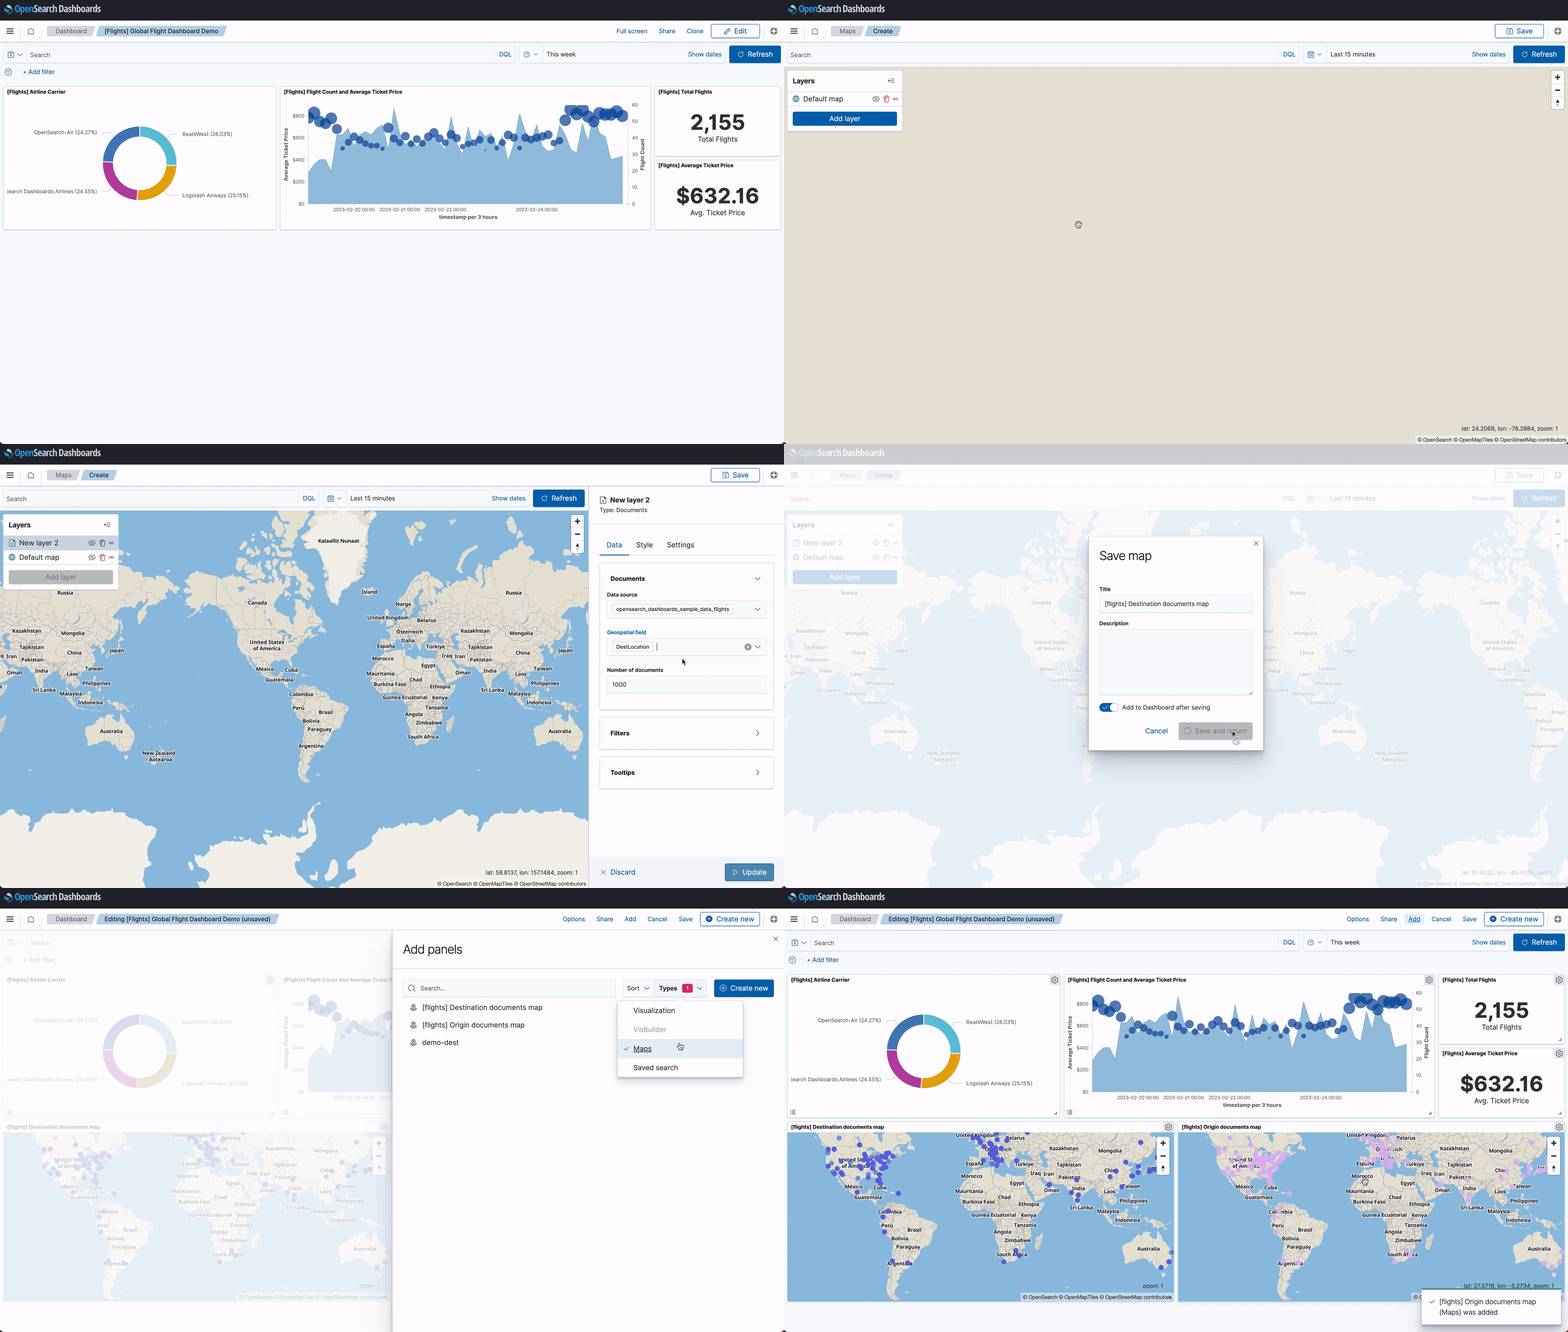
The project continues to deliver enhancements to help users input and visualize geographic data. With this release, you have the ability to add maps to dashboard panels within OpenSearch Dashboards. Previously, maps could only be created and displayed inside the Maps plugin; now you can access maps for visualization and analysis without leaving the Dashboards environment.

Generate reports directly from dashboards
OpenSearch 2.6.0 supports the OpenSearch Reporting CLI, launched this month separately from the project’s release cycle. The new CLI offers an out-of-the-box way to generate and download reports directly from OpenSearch Dashboards programmatically. Now you can use the Reporting CLI to create reports in PDF, PNG, or CSV format and distribute them as a file to downstream messaging systems. Check out the documentation to get started.
Automatically protect against traffic surges
OpenSearch uses search backpressure to identify resource-intensive search requests and cancel them when traffic to the node exceeds resource limits. With this release, OpenSearch can now cancel queries at the coordinator node level and therefore provide more efficient protection against traffic surges that result from a small number of resource-intensive queries.
Authenticate data sources with SigV4
While the ability to add multiple data sources from OpenSearch Dashboards remains an experimental feature in 2.6.0, this release adds support for AWS Signature Version 4 (AWS SigV4) as a request authentication method for connecting to data source domains, such as Amazon OpenSearch Service domains with AWS Identity and Access Management (IAM) authentication enabled.
Getting started
You can download the latest version of OpenSearch here, and you can check out OpenSearch Dashboards live on the Playground. For more information about this release, see the release notes and the documentation release notes. We welcome your feedback on this release in the community forum!


