Feature Deep Dive: OpenSearch Dashboards Notebooks
OpenSearch Dashboards Notebooks lets you easily combine live visualizations, narrative text, and SQL and Piped Processing Language (PPL) queries so that you can tell your data’s story. You can interactively explore data by running different visualizations and share them with team members to collaborate. Notebooks can help with a variety of use cases such as creating postmortem reports, designing operations run books, building live infrastructure reports, and even documentation. With OpenSearch 1.0, Notebooks is now production ready. Additionally, multiple enhancements were introduced such as support for multi-tenancy, query languages like SQL and PPL and an integration with reporting.
In this blog we will explore popular use cases for Notebooks, how the feature works, and how to get started with it.
What problem does OpenSearch Dashboards Notebooks solve?
Before Notebooks, there was no built-in way to combine text, queries, visualizations, and dashboards to build contextual views of data stored in OpenSearch. This made it difficult to convey important results and summaries in a way that can be consumed easily. As an example, when creating a post mortem report for a customer issue, you had to collaborate with multiple stakeholders like support engineers, devops, developers, and your management. It involved relying on multiple tools like text editors, wikis, notes, and screenshots to create documents and reports. This process was time consuming and the documents and reports generated contain static data and visualizations. You could not tell the full story from the data and had to share generic dashboards and visualizations that left interpretation open to your stakeholders.
How does OpenSearch Dashboards Notebooks solve the problem?
Notebooks was built to address this problem by enabling you to interactively and collaboratively develop rich reports backed by live data, and queries in cells or paragraphs that can combine markdown, SQL and PPL queries, and visualizations with support for multi-timelines so that you can easily tell a story. They can be developed, shared as a PDF, PNG or an OpenSearch Dashboards endpoint, and refreshed directly from OpenSearch Dashboards to foster data driven exploration and collaboration between you and your stakeholders. In this release, we integrated Notebooks with other OpenSearch features and libraries like the SQL and PPL query engine, reporting engine, and OpenSearch Dashboard APIs. We used the nteract library to render paragraphs and markdown.
How do you use OpenSearch Dashboards Notebooks?
To get started, choose Notebooks within OpenSearch Dashboards.
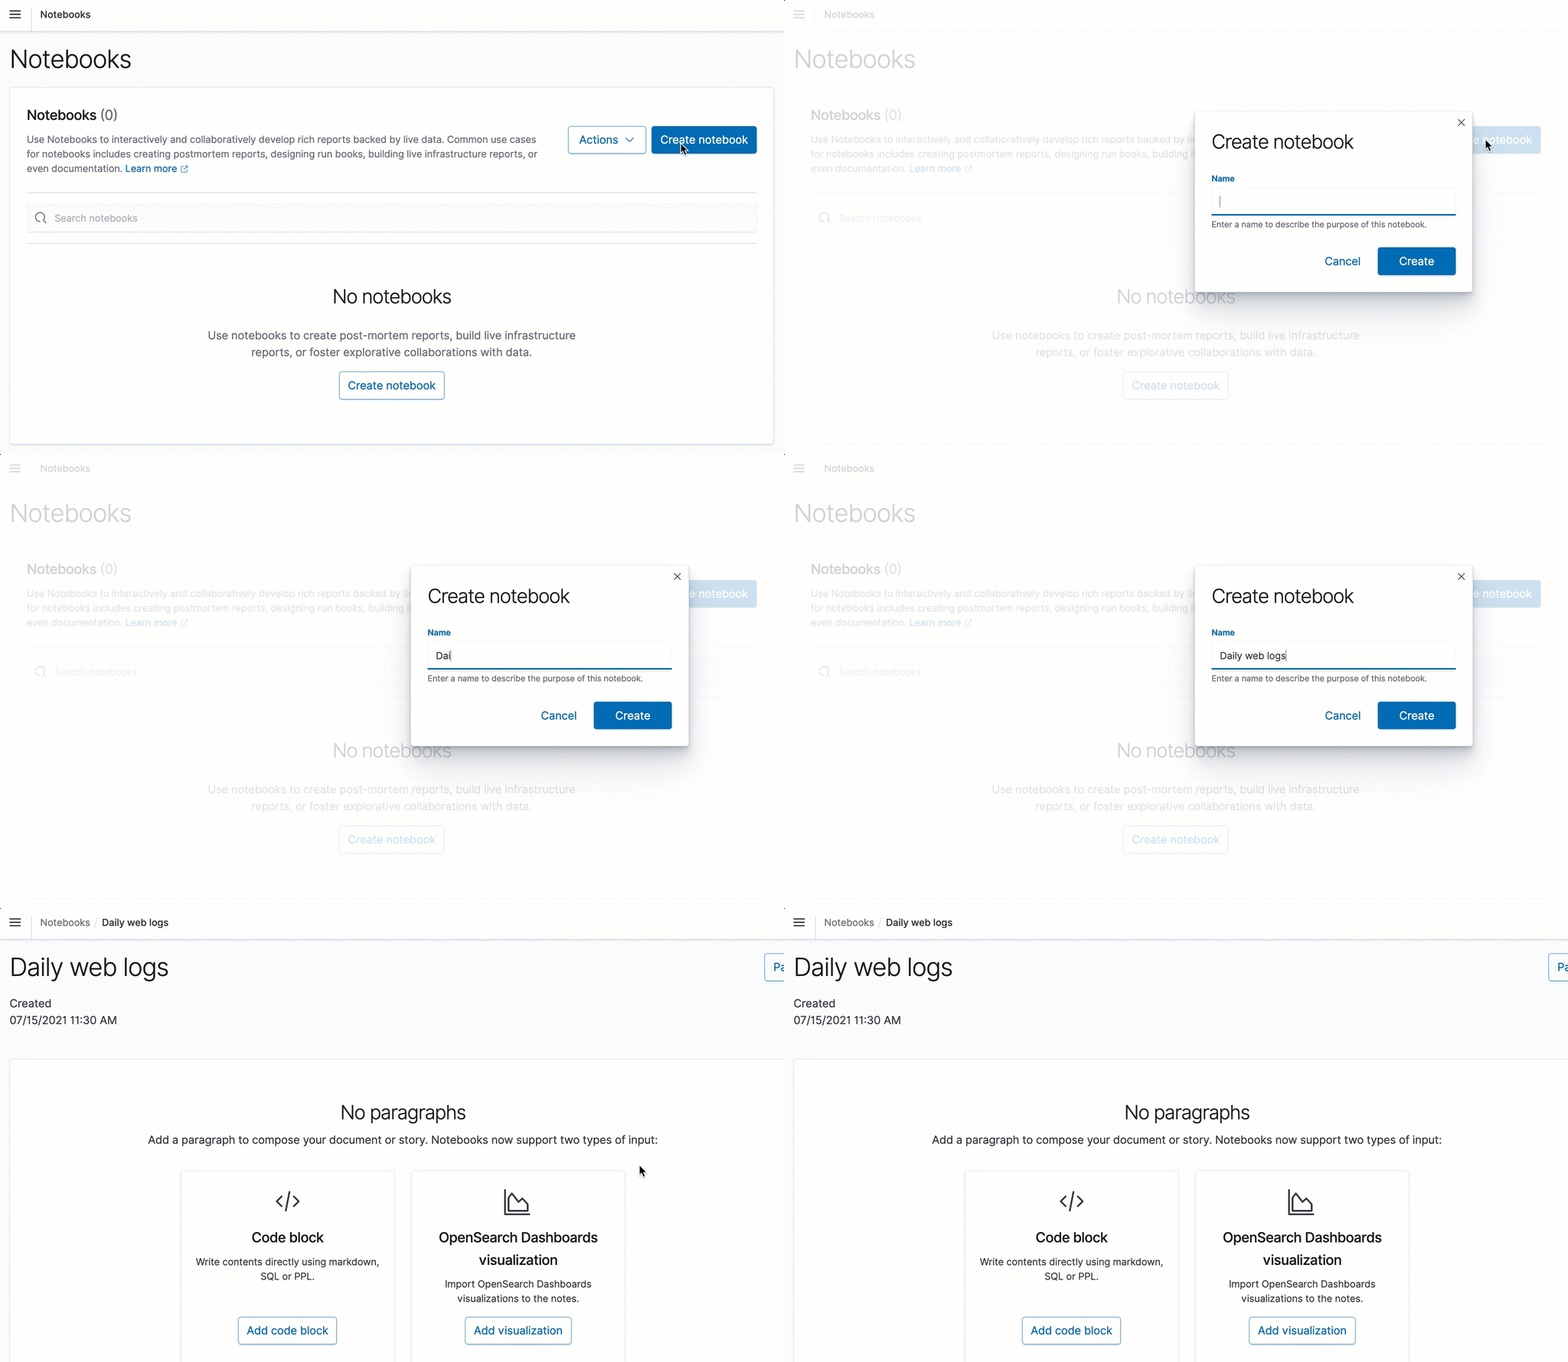
Step 1: Create a notebook
- Choose Create notebook and enter a descriptive name.
- Choose Create.
Choose Actions to rename, duplicate, or delete a notebook.
Step 2: Add paragraphs
Paragraphs combine code blocks and visualizations for describing data.
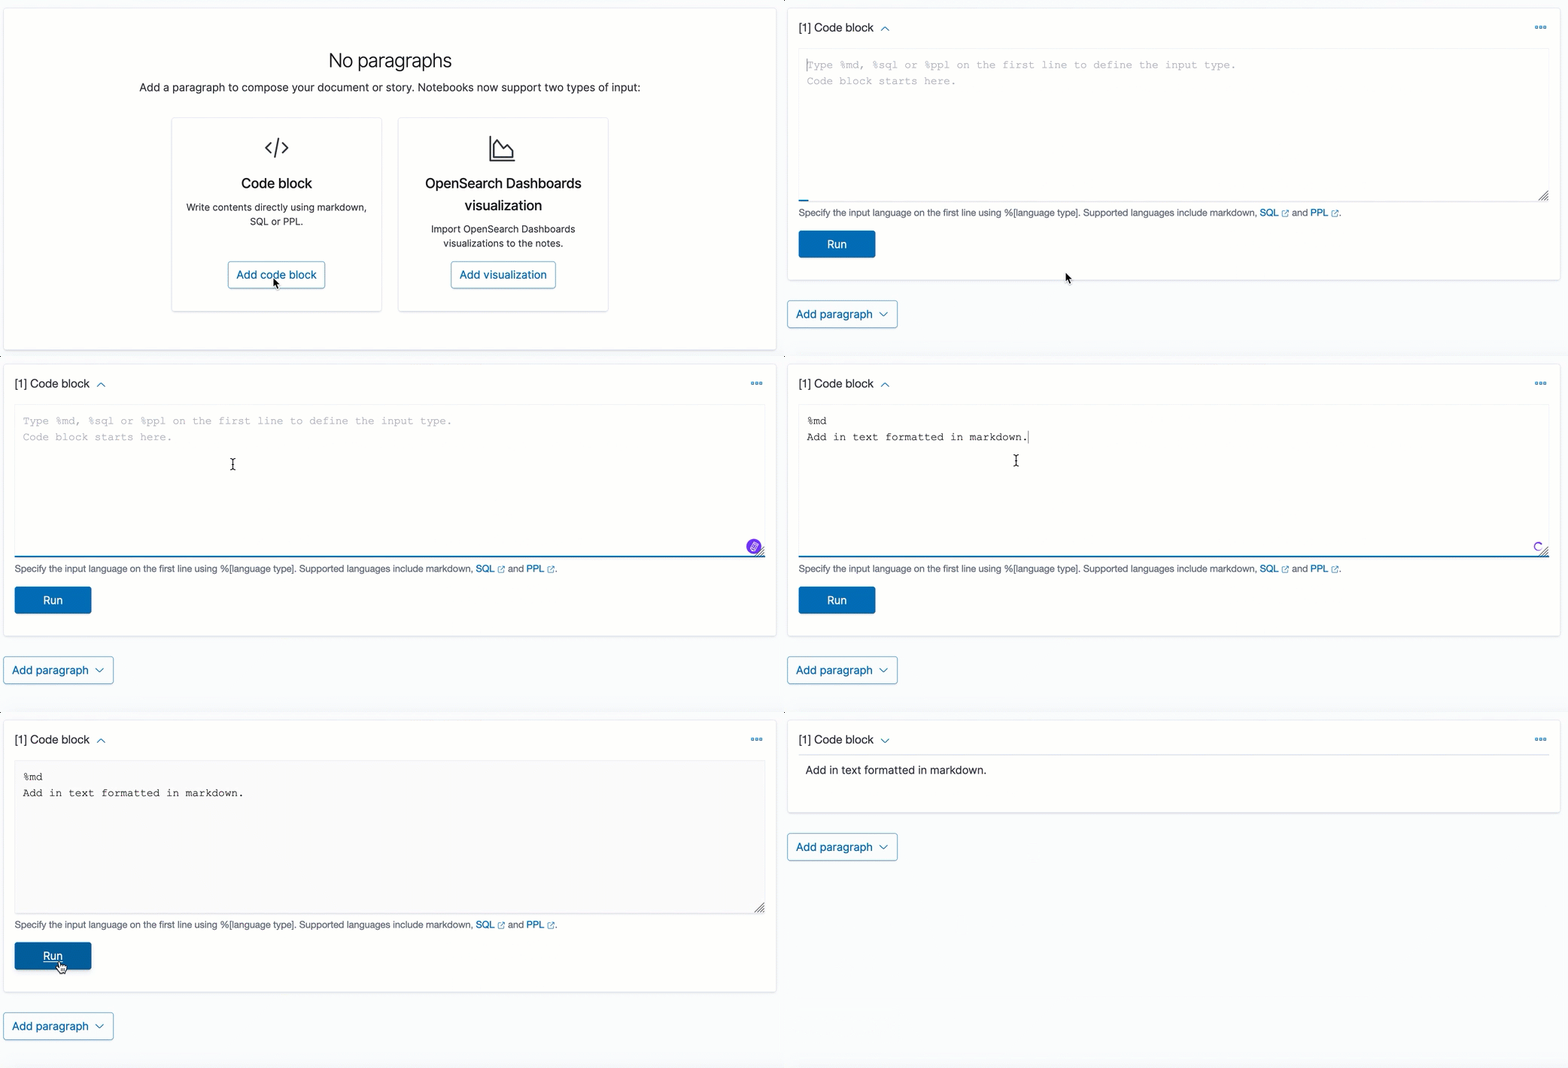
Add a code block
Code blocks support markdown, SQL, and PPL languages.
Specify the input language on the first line using %[language type] syntax. For example, type %md for markdown, %sql for SQL, and %ppl for PPL.
Sample markdown block
%md
Add in text formatted in markdown.
Sample SQL block
%sql
Select * from opensearch_dashboards_sample_data_flights limit 20;
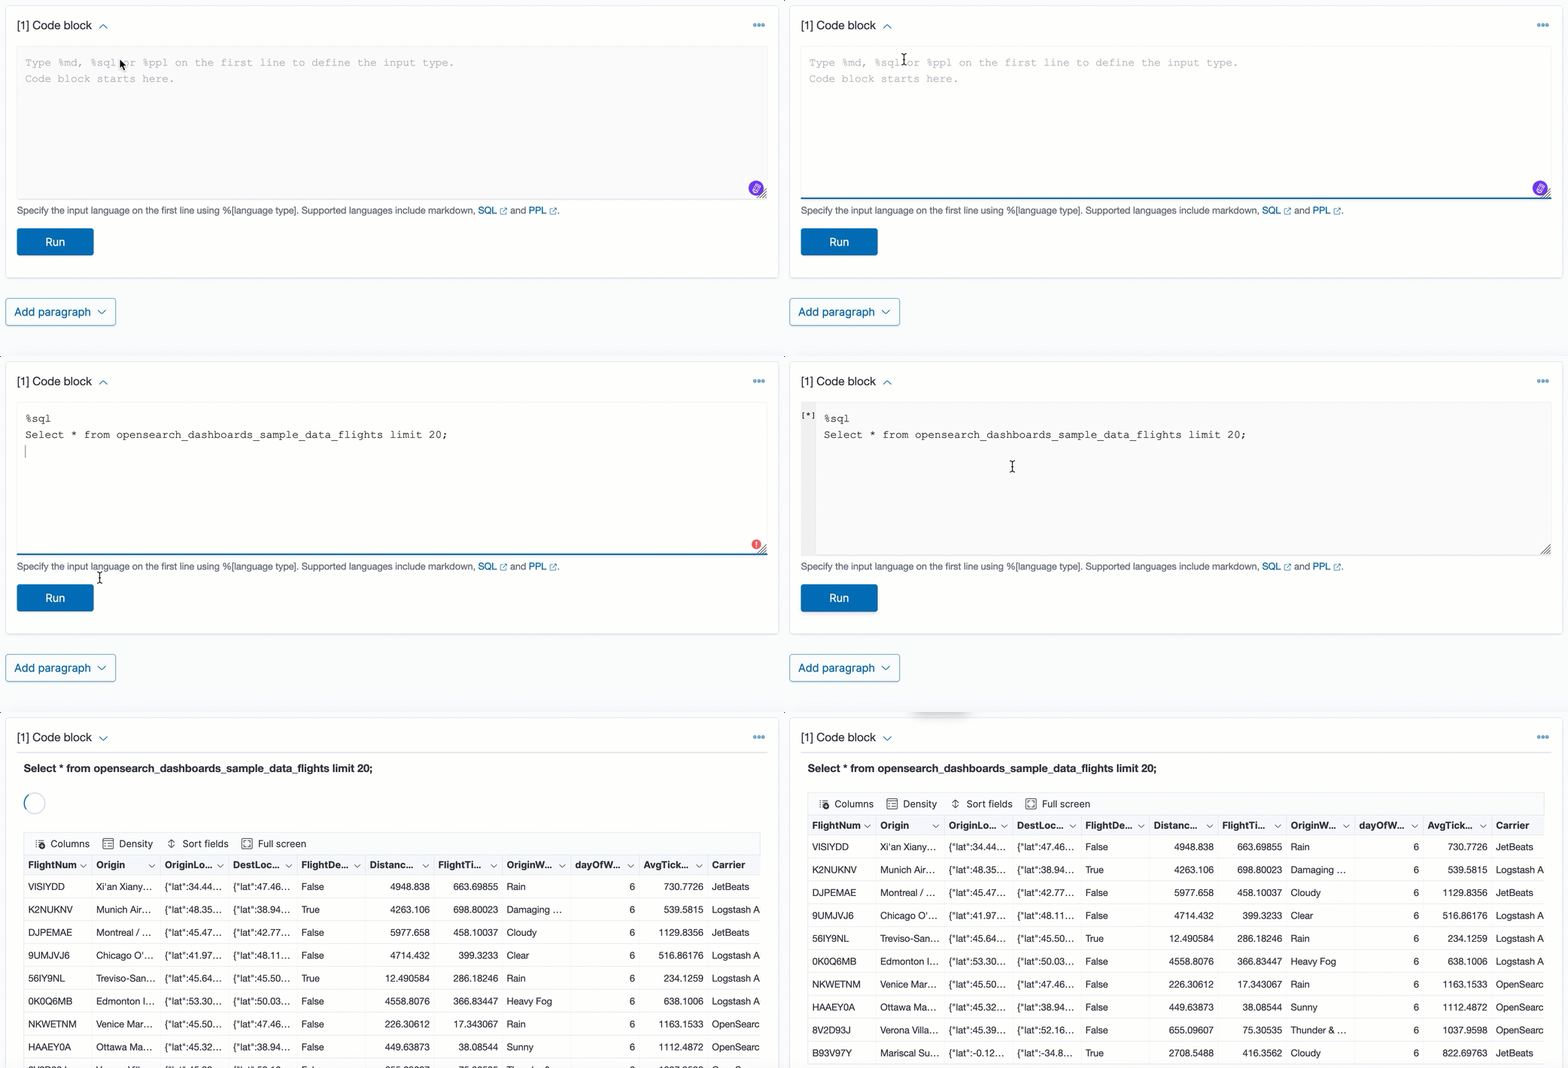
Sample PPL block
%ppl
source=opensearch_dashboards_sample_data_logs | head 20
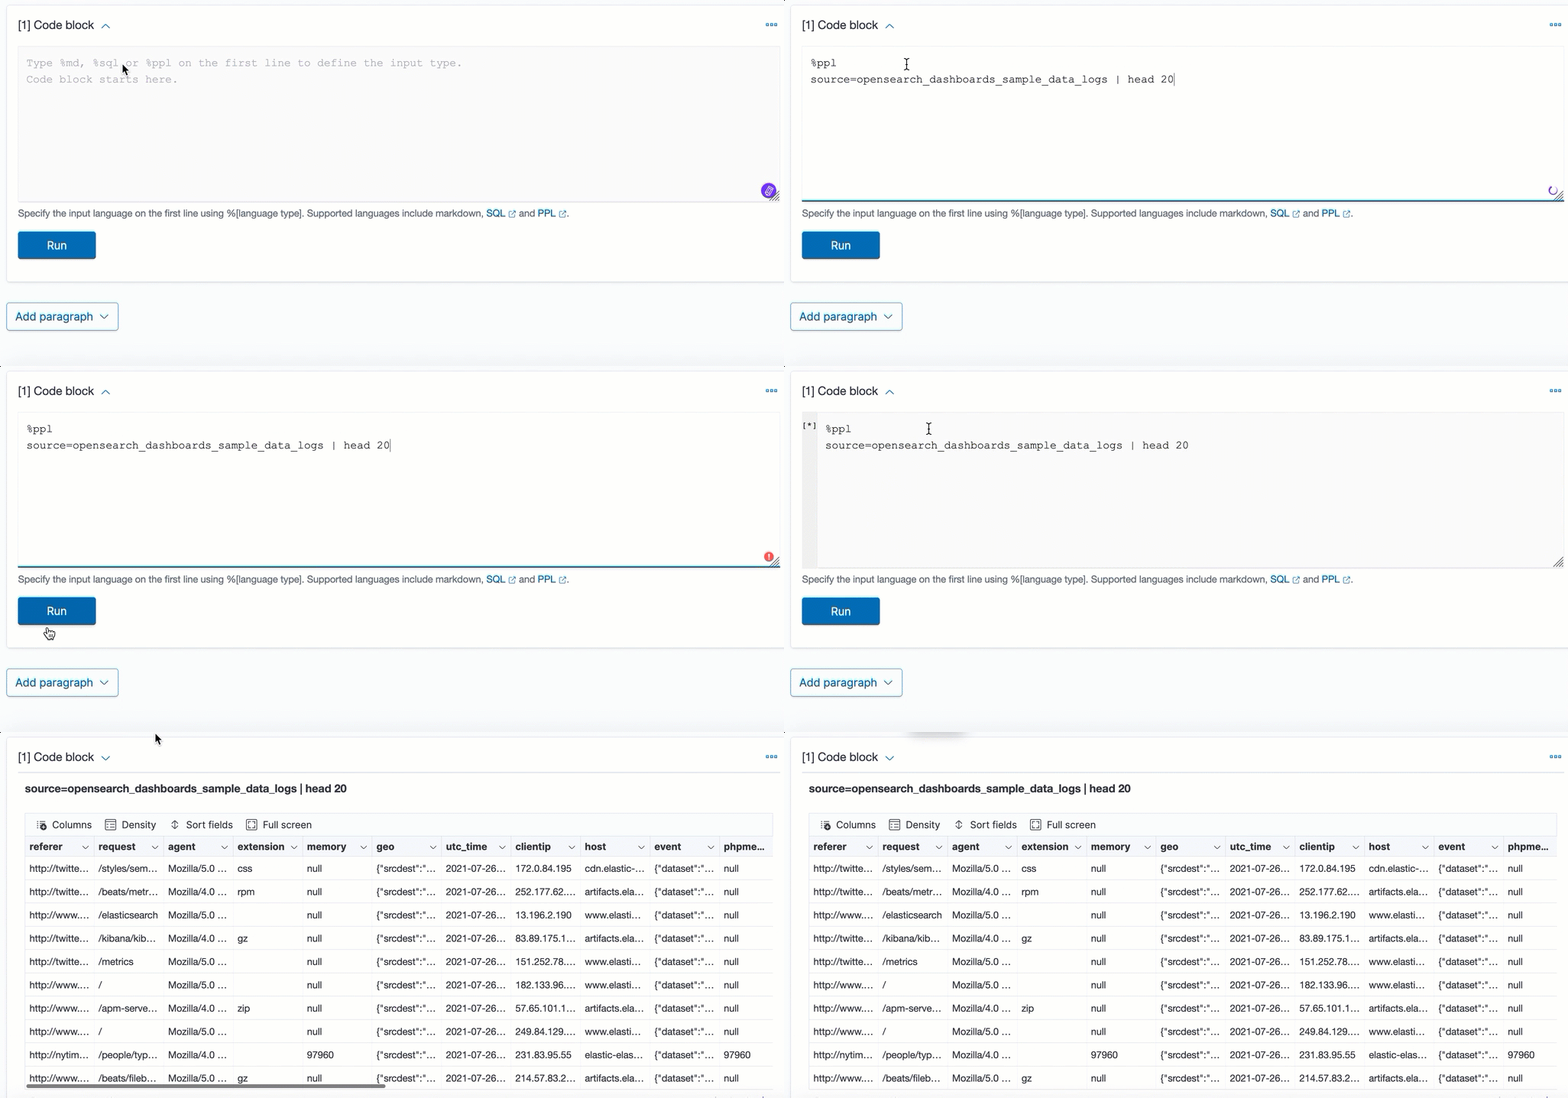
Add a visualization
- To add a visualization, choose Add paragraph and select Visualization.
- In Title, select your visualization and choose a date range. You can choose multiple timelines to compare and contrast visualizations.
- To run and save a paragraph, choose Run.
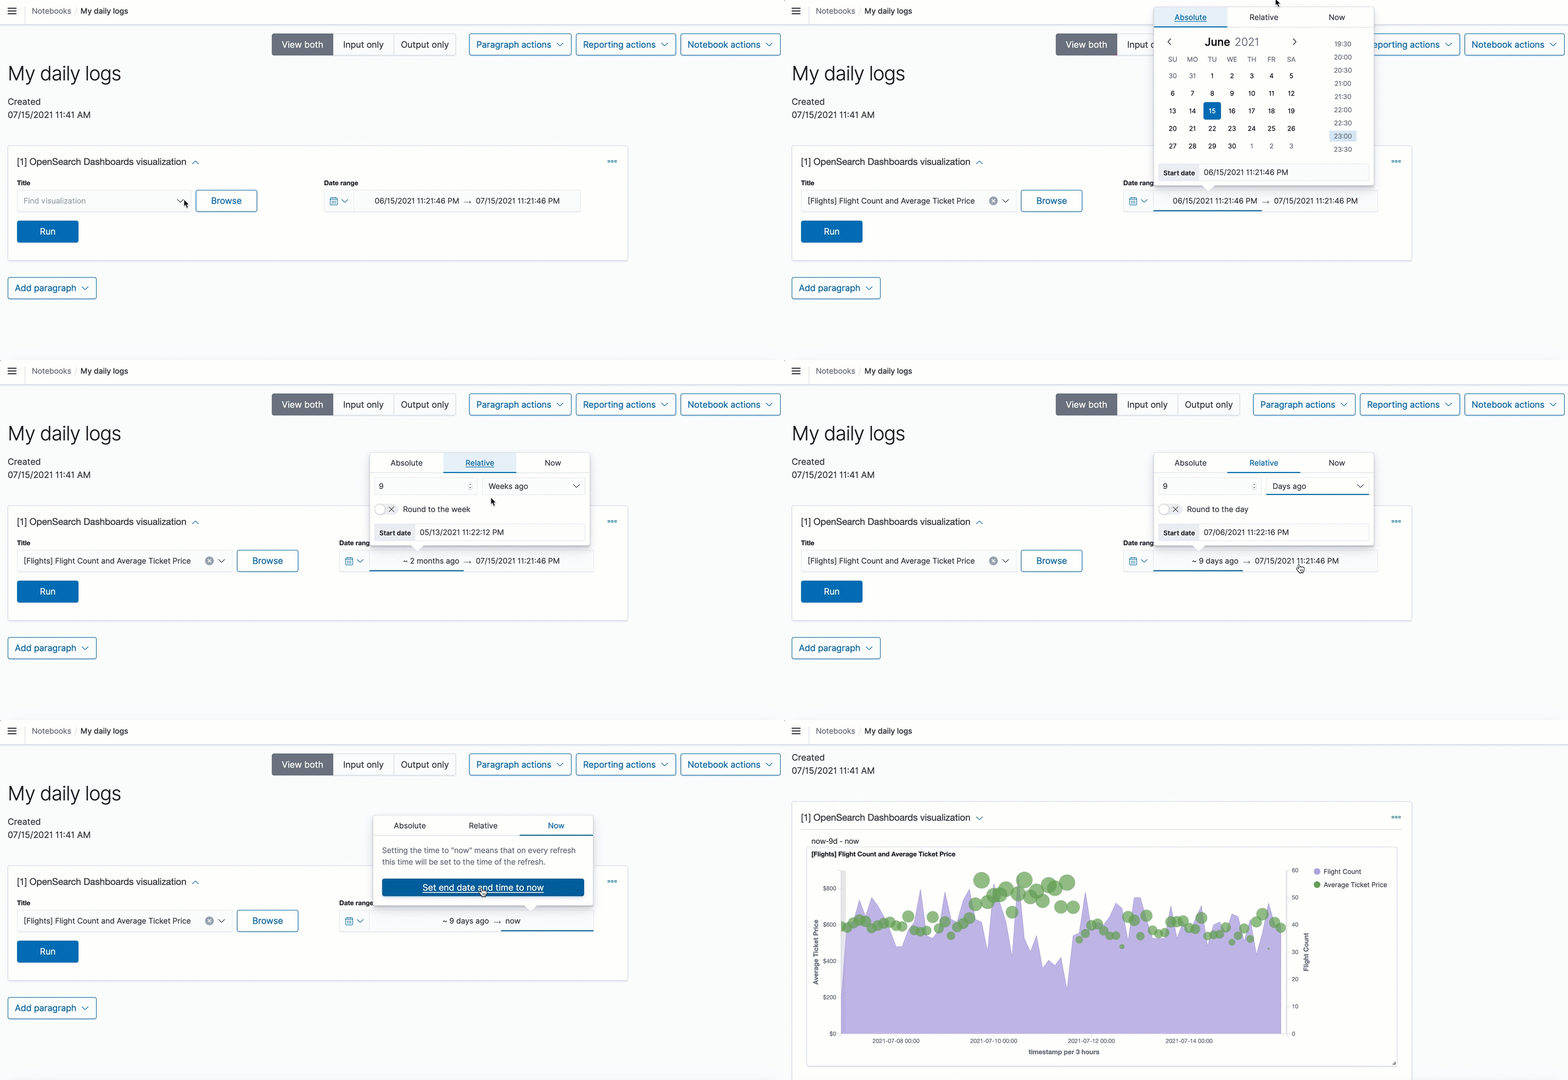
Paragraph actions
You can perform the following actions on paragraphs:
- Add a new paragraph to the top of a report,
- Add a new paragraph to the bottom of a report,
- Run all the paragraphs at the same time,
- Clear the outputs of all paragraphs,
- Delete all the paragraphs.

Sample notebooks
We prepared the following sample notebooks that showcase a variety of use cases:
- Using SQL to query the OpenSearch Dashboards sample flight data.
- Using PPL to query the OpenSearch Dashboards sample web logs data.
- Using PPL and visualizations to perform sample root cause event analysis on the OpenSearch Dashboards sample web logs data.
To add a sample notebook, choose Actions and select Add sample notebooks.
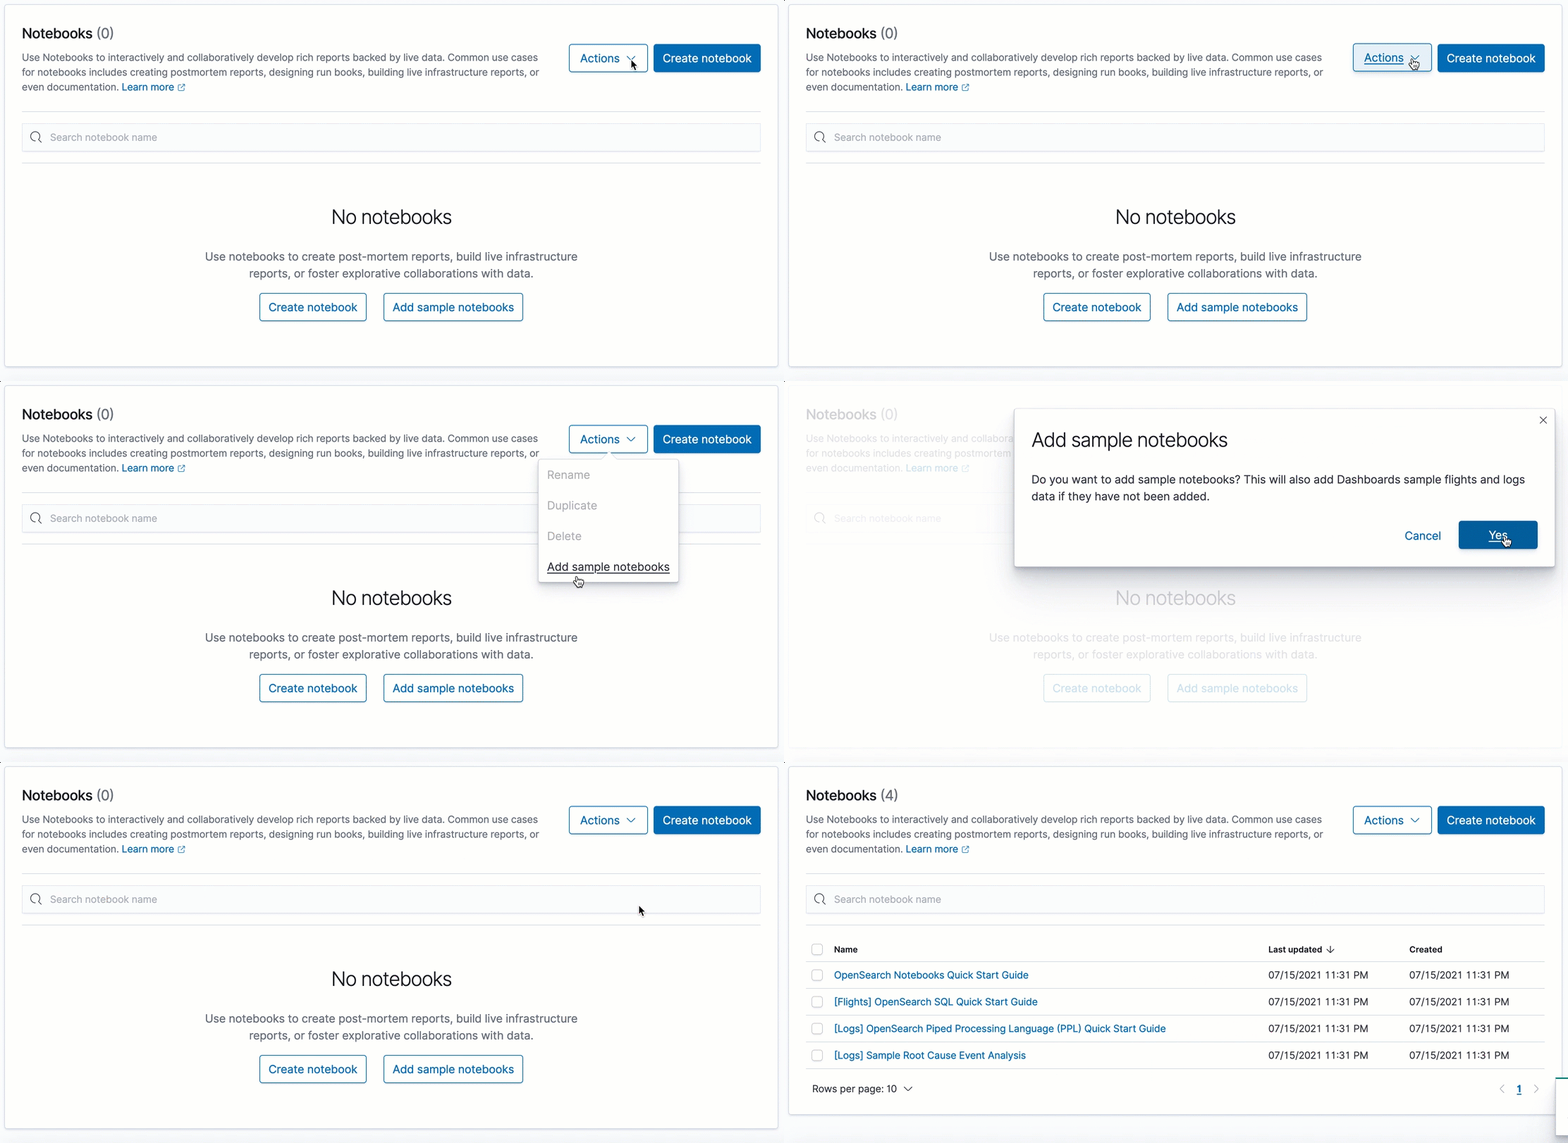
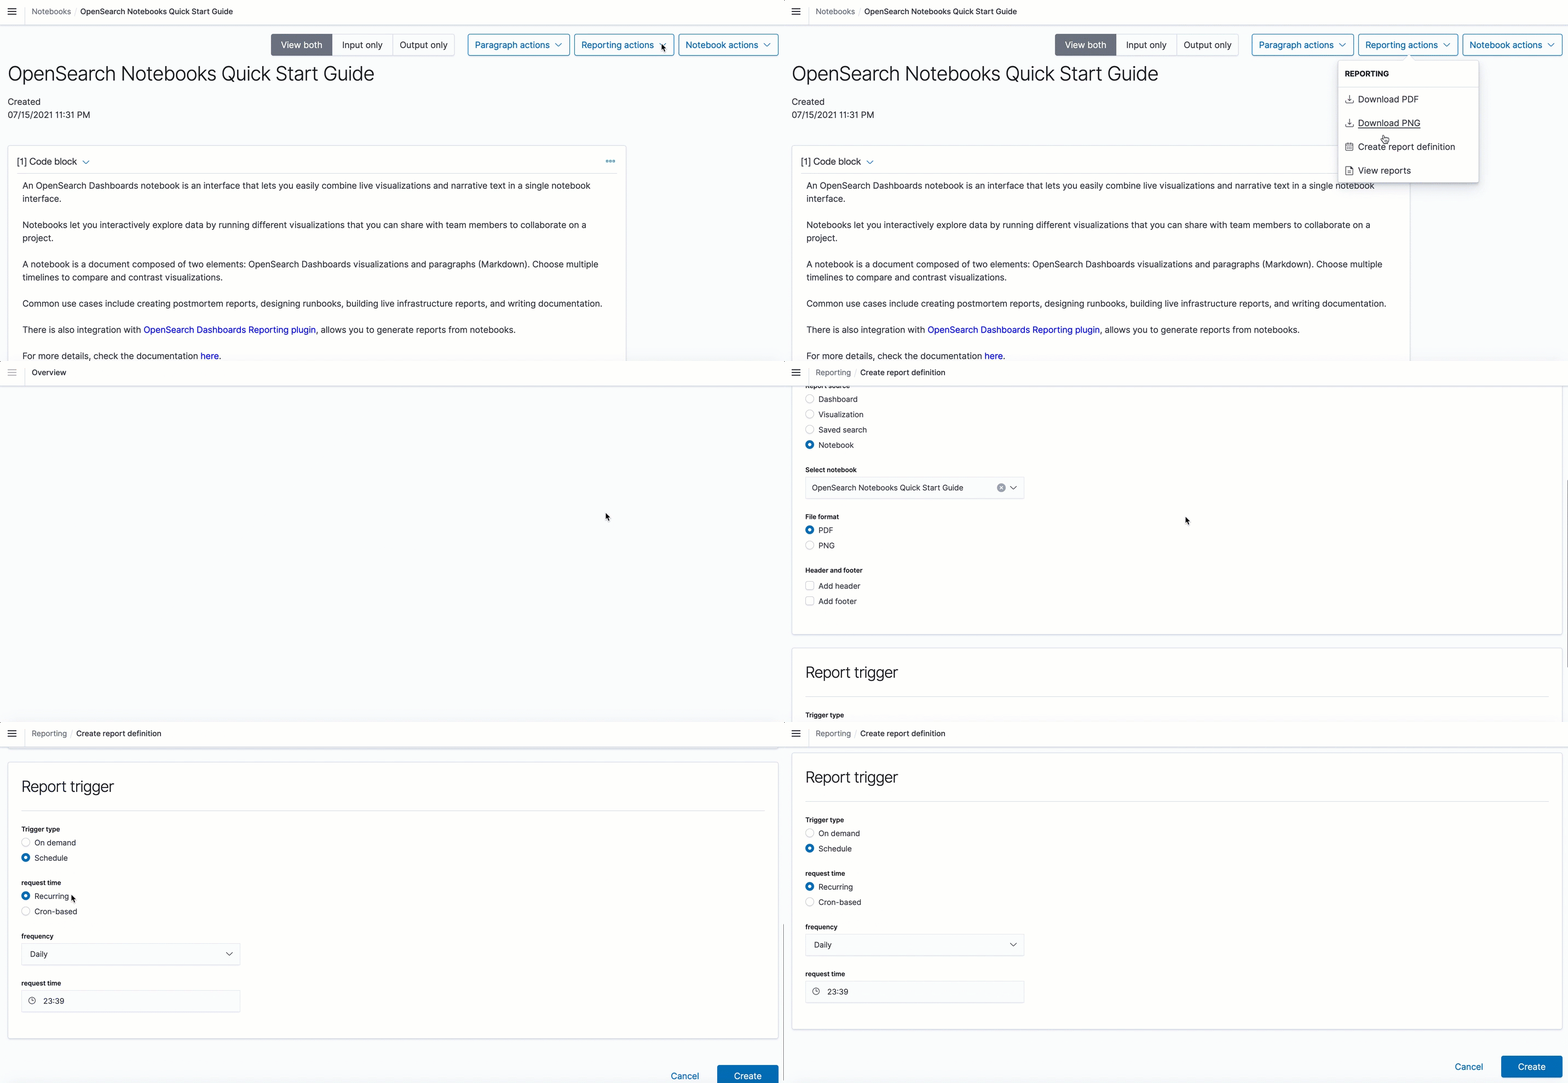
Create a report
You can use notebooks to create PNG and PDF reports:
- From the top menu bar, choose Reporting actions.
- You can choose to Download PDF or Download PNG.
- Reports generate asynchronously in the background and might take a few minutes, depending on the size of the report. A notification appears when your report is ready to download.
- To create a schedule-based report, choose Create report definition. For steps to create a report definition, see the create report documentation.
- To see all your reports, choose View all reports.
How do I contribute?
If you’re interested in contributing please reach out on GitHub issues or the community forum. The more formal contribution guidelines are documented in the contributing guide.
Thank you
We would like to thank @ps48, @joshuali925 , davidcui1225 , chloe-zh and lvndc for their contributions to this feature.
