


Enhanced log analysis with OpenSearch PPL: Introducing lookup, join, and subsearch
OpenSearch 3.0 introduced powerful new capabilities to the Piped Processing Language (PPL) with the addition of the lookup, join, and subsearch commands. These commands help you enrich, correlate, and filter logs more efficiently. They are particularly useful in observability and log analytics scenarios. For example, you can join authentication and application logs to investigate security incidents or use the lookup command to add geolocation context to logs in real time. To learn more about supported PPL commands, see the PPL command reference.
These enhancements are powered by Apache Calcite, which also improves query planning and execution. Together, they lay the foundation for more advanced analytics in future versions. With this update, PPL becomes an even more expressive and efficient language for interactive data exploration.
Let’s explore these new features in detail and see how they can enhance your log analysis workflows.
What’s new in OpenSearch 3.0 PPL: Lookup, join, and subsearch
If you analyze logs regularly, you know how challenging it can be to sift through large volumes of data in order to detect and investigate potential issues. OpenSearch 3.0 introduced three new PPL commands—lookup, join, and subsearch. These commands simplify complex log queries and improve efficiency.
The lookup, join, and subsearch commands are experimental features. To use them, you need to enable Calcite in your OpenSearch instance. You can do this using the following request:
curl -H 'Content-Type: application/json' -X PUT localhost:9200/_plugins/_query/settings -d '{
  "transient" : {
    "plugins.calcite.enabled" : true
  }
}'
Before diving into the new commands, let’s look at the sample datasets we’ll use throughout this blog post.
Sample datasets used in this post
To demonstrate how the new commands work, we’ll use the following sample datasets. Understanding their structure will help you follow the examples more easily.
Authentication logs (auth_logs)
This dataset tracks user login attempts and includes details such as timestamps, usernames, login status, and IP addresses.
timestamp |
user_id |
status |
ip_address |
|---|---|---|---|
| 2024-04-29T10:00:00Z | jdoe | success | 192.168.1.1 |
| 2024-04-29T10:05:00Z | asmith | failed | 192.168.1.2 |
| 2024-04-29T10:10:00Z | jdoe | success | 192.168.1.1 |
Application logs (app_logs)
This dataset records user interactions with an application, such as login and logout events.
timestamp |
user_id |
action |
session_id |
|---|---|---|---|
| 2024-04-29T10:00:05Z | jdoe | login | abc123 |
| 2024-04-29T10:05:10Z | asmith | login | def456 |
| 2024-04-29T10:10:15Z | jdoe | logout | abc123 |
User information (user_info)
This reference dataset contains additional details about users, such as their department and role.
user_id |
department |
role |
|---|---|---|
| jdoe | HR | Manager |
| asmith | IT | Analyst |
Now that you’re familiar with the datasets, let’s explore how to use the new PPL commands to analyze the data.
Lookup: Enrich authentication logs with user information
To gain more context about the users in your authentication logs, use the lookup command to combine auth_logs with the user_info dataset.
The following query enhances the authentication logs by appending the department and role fields, helping you better understand the users associated with the failed login attempts:
source=auth_logs | lookup user_info user_id | where status='failed'
A sample result appears as follows.
timestamp |
user_id |
status |
ip_address |
department |
|---|---|---|---|---|
| 2024-04-29T10:05:00Z | asmith | failed | 192.168.1.2 | IT |
Join: Correlate authentication and application logs
To analyze user behavior across systems, you can join auth_logs with app_logs based on the user_id and a timestamp. This correlation helps you track users’ actions and understand their interactions with applications:
source=auth_logs
| join left=l right=r ON l.user_id = r.user_id AND TIME_TO_SEC(TIMEDIFF(r.timestamp, l.timestamp)) <= 60 app_logs
| fields timestamp, user_id, action
A sample result appears as follows.
timestamp |
user_id |
action |
status |
|---|---|---|---|
| 2024-04-29T10:00:00Z | jdoe | login | success |
| 2024-04-29T10:05:00Z | asmith | login | failed |
| 2024-04-29T10:10:00Z | jdoe | logout | success |
Subsearch: Investigate suspicious activity using subsearch
You can use the subsearch command to identify users who experienced failed login attempts and later performed specific actions, such as logging in successfully. This helps surface potentially unauthorized access attempts for further investigation:
source=auth_logs
| where status='failed' AND exists [source=app_logs | where user_id=auth_logs.user_id AND action='login']
A sample result appears as follows.
timestamp |
user_id |
status |
|---|---|---|
| 2024-04-29T10:05:00Z | asmith | failed |
When to use each command
Each command is designed for a specific type of log analysis task. Here’s a quick guide to help you choose the right one:
lookup– Best for enriching logs with external reference data.join– Ideal for correlating and combining logs from distinct indexes.subsearch– Excellent for dynamic query conditions based on results from another query.
To fully appreciate these new capabilities, it’s helpful to understand how Calcite integration works.
How it works: Calcite integration
OpenSearch PPL 3.0 integrates Apache Calcite, a robust SQL parsing and optimization framework. We selected Calcite for its powerful optimization capabilities, extensibility, and strong community support. Calcite integrates with OpenSearch PPL by providing parsing and query optimization layers. It converts PPL queries into optimized execution plans, significantly enhancing query efficiency and scalability.
Query lifecycle in Calcite
OpenSearch PPL reuses its existing query grammar and abstract syntax tree (AST), which are widely adopted in both OpenSearch and PPL-on-Spark. The grammar is defined using ANTLR4 and is shared across multiple backend and frontend polyglot validators, including Java, JavaScript, and Python. To maintain compatibility and reuse existing components, the integration architecture builds on this foundation, as shown in the following diagram.
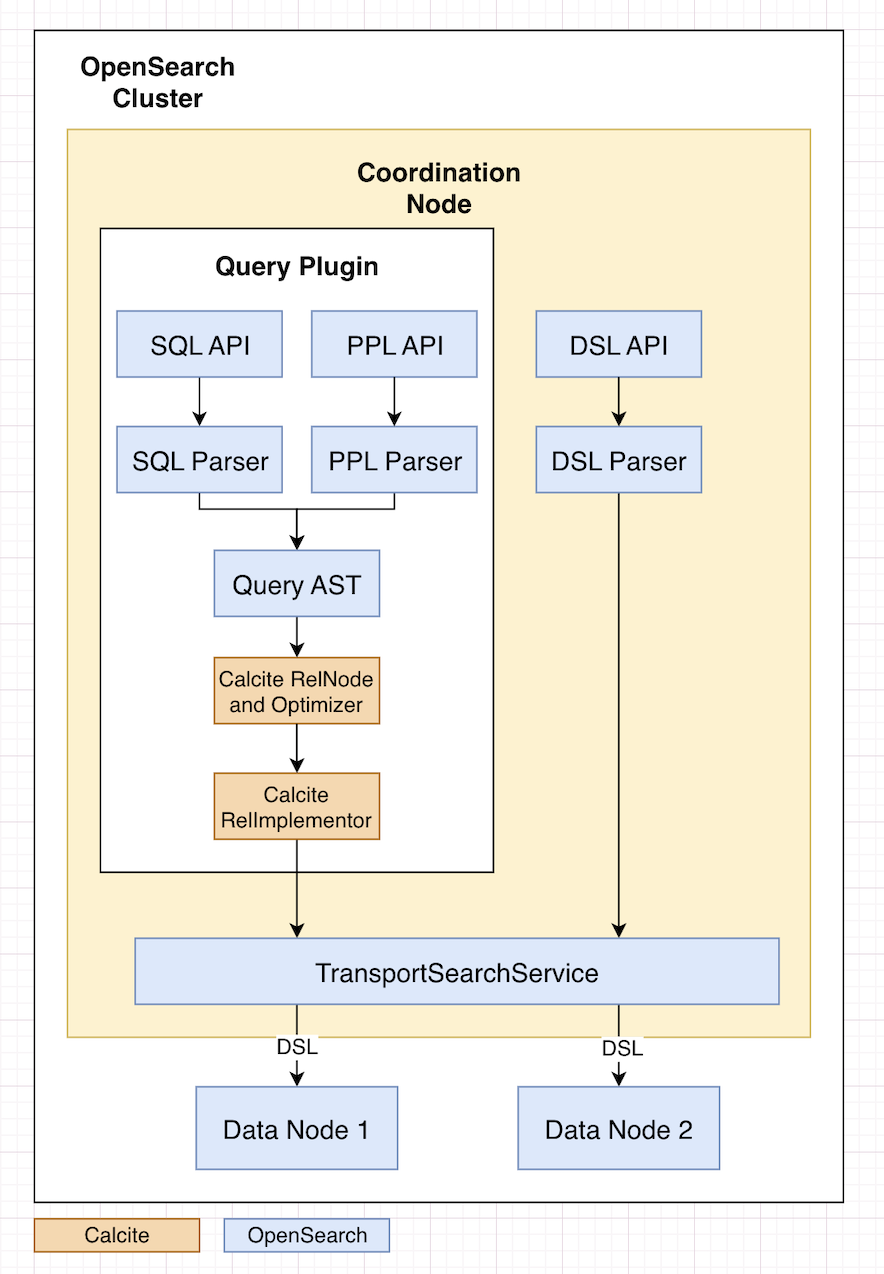
The query processing workflow consists of several transformation stages, converting a query from raw text into various intermediate representations and then the final form that is ultimately executed. Here’s a breakdown of the main stages:
-
Query parsing: First, the SQL query text is parsed using ANTLR4, which converts the raw query into a parse tree. This tree is then transformed into an AST, which represents the hierarchical syntactic structure of the query in a more abstract form.
-
Plan conversion: The AST is transformed into Calcite’s
RelNodetree usingRelBuilderand a series of visitors.RelNodeis Calcite’s internal representation of relational operations.RelNodeobjects form a logical plan tree, where each node represents a relational algebra operation such as filter, project, or join. -
Optimization and transformation: Calcite’s optimizer applies various transformation rules to the
RelNodetree. The optimized tree is then converted intoOpenSearchEnumerableRelnodes—OpenSearch-specific implementations of Calcite’s relational operators—that can be mapped toLinq4jexpressions. -
Code generation and execution: Linq4j serves as a bridge framework, providing templates and expressions for transforming relational operators into executable Java code. This code processes data in a row-by-row manner in memory. For performance optimization, when possible, operators or subtrees of the plan (such as filters and aggregations) are pushed down and converted into native OpenSearch
QueryBuilderAPI calls, which are then executed directly by the OpenSearch engine.
How the Calcite optimizer works
When you run a query, Calcite acts as the query optimizer, transforming your SQL statements into an efficient execution plan. One of the core optimization strategies it applies is filter pushdown—a technique that moves filter conditions as close as possible to the data retrieval operations. This reduces the amount of data processed and transferred, leading to significant performance improvements.
Use the explain command to inspect query plans
To view the query plan and understand how Calcite has optimized the execution, you can use the EXPLAIN command. The following example shows how to inspect a query that enriches authentication logs with user details and filters for failed login attempts:
explain source=auth_logs | lookup user_info user_id | where status='failed'
Logical plan
The logical plan represents a high-level, abstract strategy for executing the query. It outlines the operations to be performed without specifying how they should be executed. In our example, the preceding query is converted into the following logical plan:
LogicalProject(ip_address=[$0], user_id=[$1], status=[$2], timestamp=[$3], department=[$4])
  LogicalFilter(condition=[=($2, 'failed')])
    LogicalProject(ip_address=[$0], user_id=[$1], status=[$2], timestamp=[$3], department=[$10], _id=[$12], _index=[$13], _score=[$14], _maxscore=[$15], _sort=[$16], _routing=[$17])
      LogicalJoin(condition=[=($1, $11)], joinType=[left])
        CalciteLogicalIndexScan(table=[[OpenSearch, auth_logs]])
        CalciteLogicalIndexScan(table=[[OpenSearch, user_info]])
In this plan, Calcite determines that the query should filter for status='failed' and join the auth_logs table with the user_info table on the user_id field.
Physical plan
The physical plan describes how the logical plan operations will be executed. It includes specific steps and strategies, such as sorting, joining methods, and filter pushdown. After optimization, the physical plan might appear as follows:
EnumerableCalc(expr#0..5=[{inputs}], proj#0..4=[{exprs}])
  EnumerableMergeJoin(condition=[=($1, $5)], joinType=[left])
    EnumerableSort(sort0=[$1], dir0=[ASC])
      EnumerableCalc(expr#0..9=[{inputs}], proj#0..3=[{exprs}])
        CalciteEnumerableIndexScan(table=[[OpenSearch, auth_logs]], PushDownContext=[[FILTER->=($2, 'failed')], OpenSearchRequestBuilder(sourceBuilder={"from":0,"timeout":"1m","query":{"term":{"status.keyword":{"value":"failed","boost":1.0}}},"sort":[{"_doc":{"order":"asc"}}]}, requestedTotalSize=10000, pageSize=null, startFrom=0)])
    EnumerableSort(sort0=[$1], dir0=[ASC])
      EnumerableCalc(expr#0..7=[{inputs}], proj#0..1=[{exprs}])
        CalciteEnumerableIndexScan(table=[[OpenSearch, user_info]])
In this plan, Calcite pushed down the filter condition status='failed' to the CalciteEnumerableIndexScan operation for the auth_logs table. The filter is then converted to OpenSearch query domain-specific language (DSL). This means that filtering occurs directly at the data retrieval stage, minimizing the amount of data loaded into memory and processed by subsequent operations.
What’s next
The OpenSearch community is continuing to build on the Calcite integration and expand PPL’s capabilities. Here’s what’s planned:
- Migrate SQL to the Calcite framework – Unifying SQL and PPL under the Calcite optimizer will streamline query processing and enable more consistent behavior across query languages.
- Add more PPL commands – New commands, such as
eventstatsandstreamstats, are planned in order to support advanced analytical use cases.
We invite you to explore the new features in OpenSearch PPL 3.0, share feedback, and contribute to future improvements. Try out the new PPL 3.0 features in your OpenSearch cluster and see how they can improve your log analysis and query workflows. Your input helps shape the direction of the project and ensure that it meets the needs of the community.