


Diving deep into distributed microservices with OpenSearch and OpenTelemetry
In modern distributed systems, understanding the interactions between microservices is crucial for identifying performance bottlenecks and diagnosing failures. In this blog post, we’ll demonstrate the new features introduced in the Trace Analytics plugin in OpenSearch version 3.1, such as enhanced service map visualizations, advanced span grouping, and latency distribution charts. We’ll also show how OpenTelemetry (OTel) Collector with OpenSearch Data Prepper can be used to instrument, collect, and ingest telemetry data into OpenSearch. Then, we’ll walk through how to use OpenSearch Dashboards to explore, visualize, and analyze an observability investigation workflow.
Setting up the demo
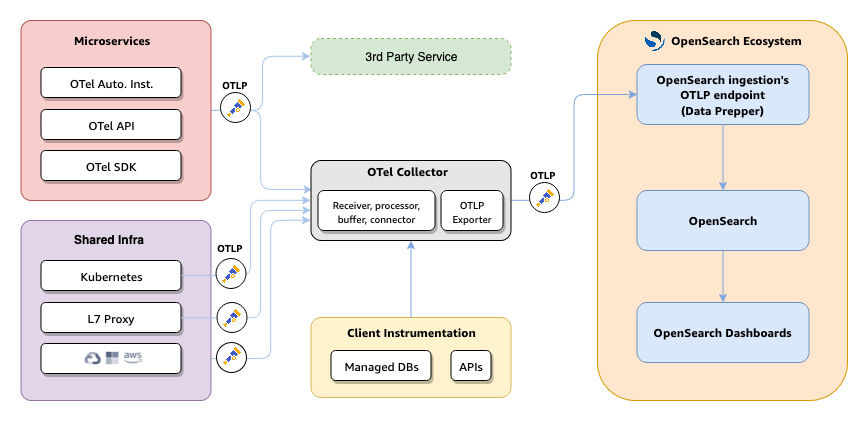
We’ll use the OpenTelemetry Astronomy Shop, an e-commerce site composed of multiple microservices. This demo is available at opentelemetry-demo. A Docker Compose setup launches the Astronomy Shop services and the following components:
- OpenSearch Data Prepper: Ingests logs and traces into OpenSearch.
- OpenSearch: Stores telemetry data and serves as the search engine.
- OpenSearch Dashboards: Provides a unified UI for logs, metrics, and traces.
The architecture of the demo is shown in the following diagram.
OpenTelemetry Astronomy Shop
The Astronomy Shop includes services such as Frontend, Cart, Ad, Accounting, Currency, Payment, and Checkout, as shown in the following image. Each service is implemented in a different language and uses the OTel SDK to emit spans and metrics.

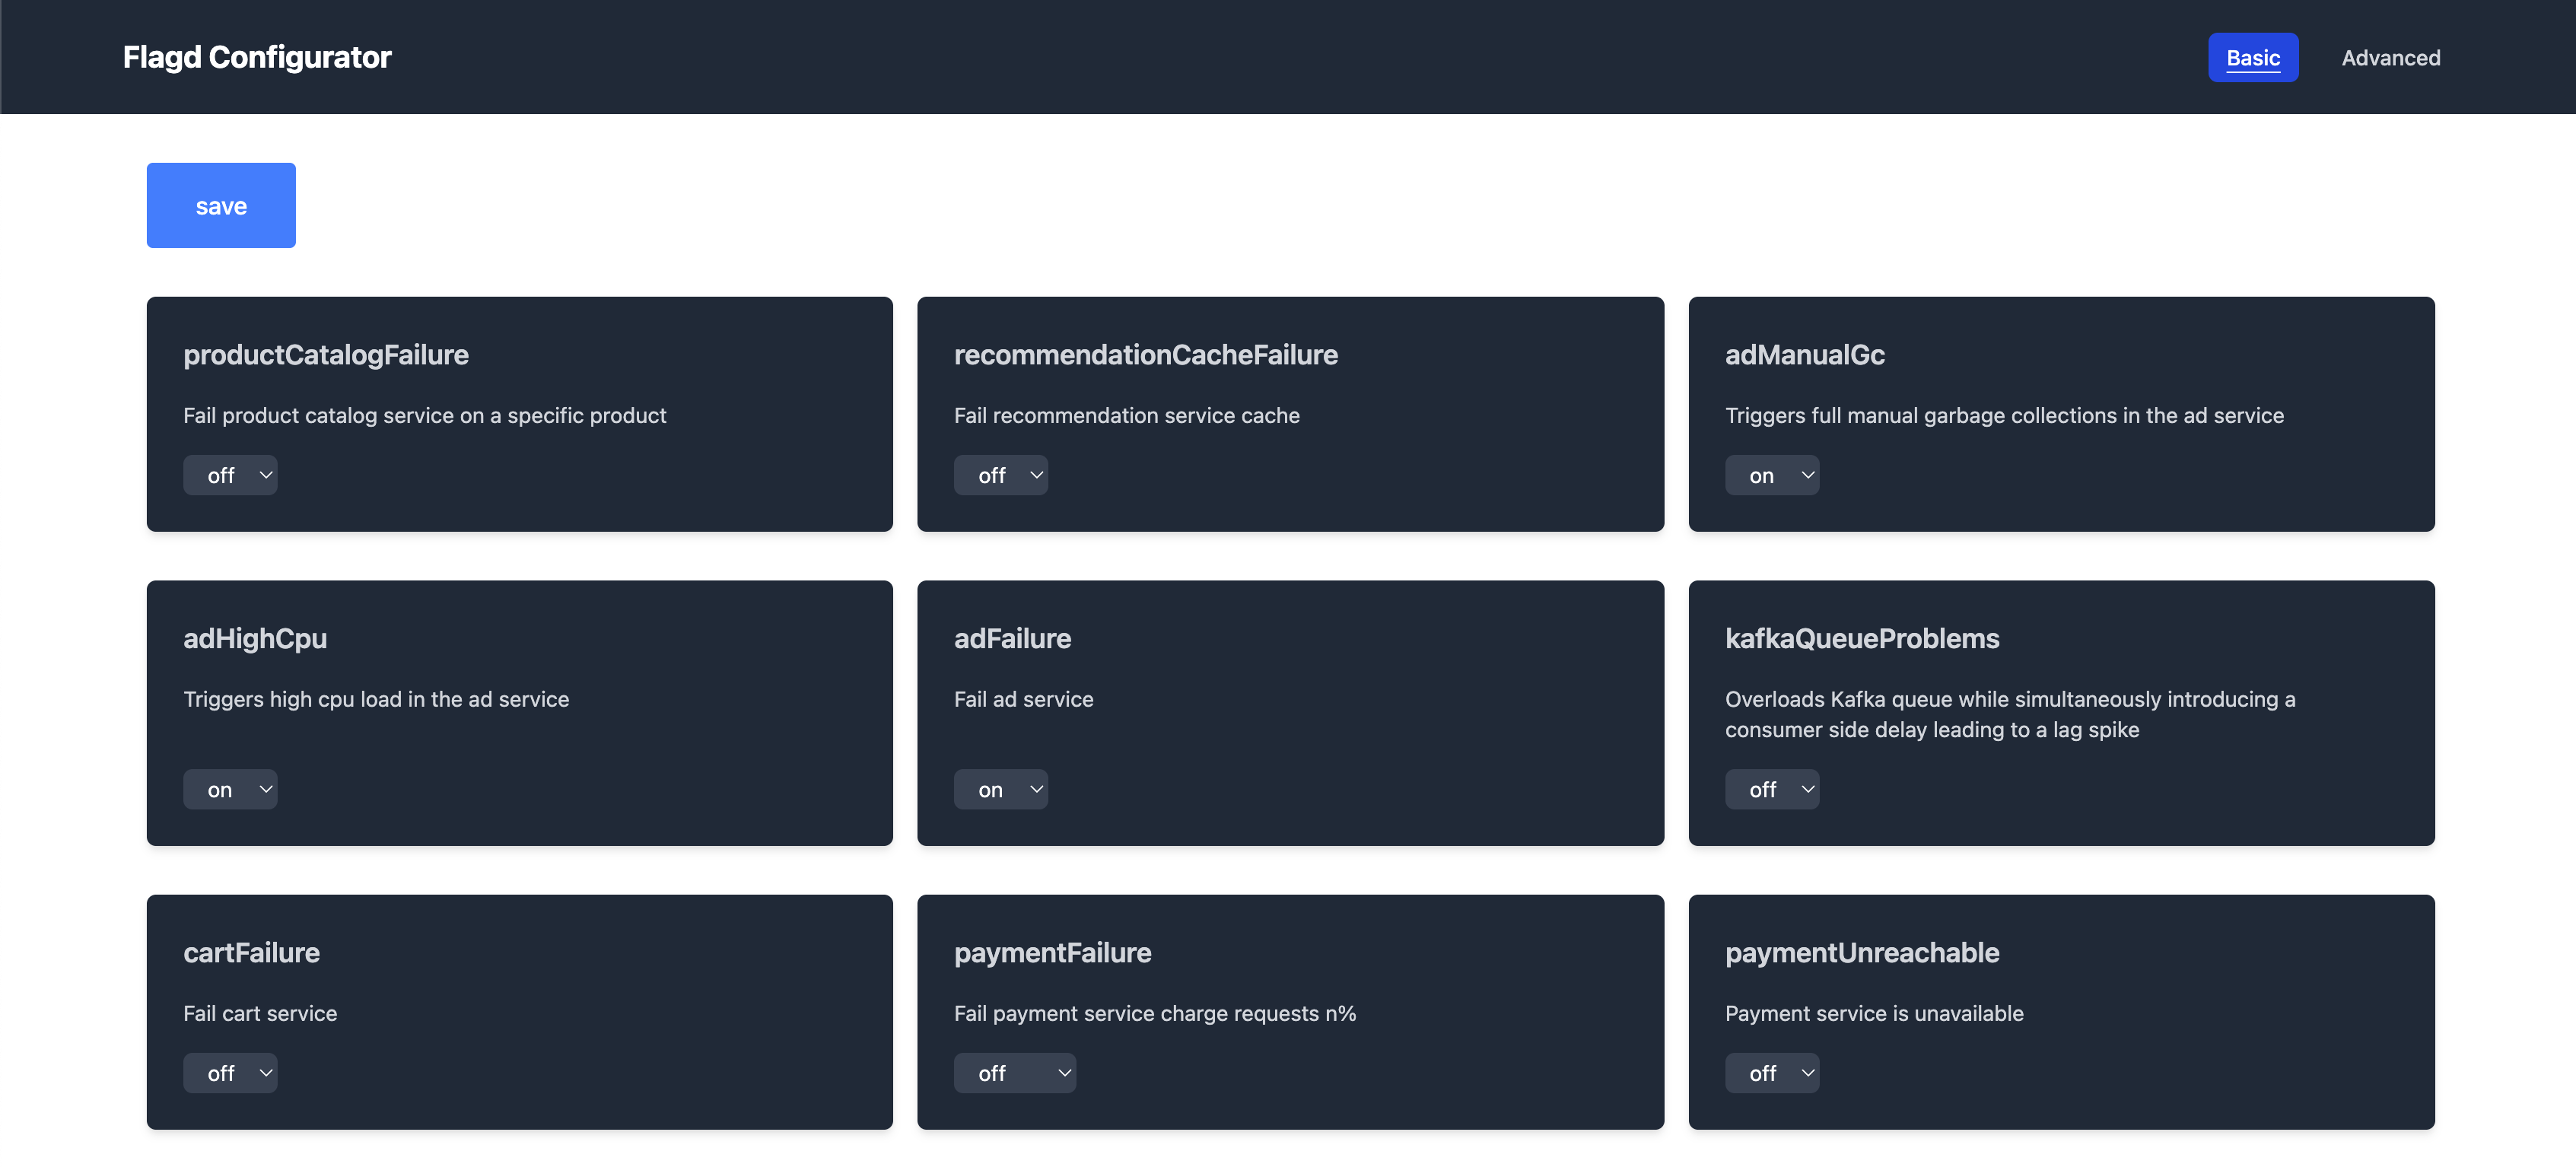
Feature flags in the OTel demo
The demo includes a feature-flag service to simulate failures, including adServiceHighCpu, cartServiceFailure, productCatalogFailure, paymentServiceFailure, and more, shown in the following image. In this walkthrough, we will focus on the Ad service, triggering a high-error-rate scenario to illustrate how to detect and diagnose faults.
OpenSearch Dashboards
OpenSearch Dashboards includes several observability plugins. For this demo, enable the following plugins:
- Workspaces: Organizes related dashboards and queries.
- Query Enhancements: Adds autocomplete, syntax highlighting, and AI‑powered suggestions.
- Query Assist: Enables natural language and AI‑driven query generation.
For the demo, we also configured the following plugins:
- Services: Shows Rate, Errors, Duration (RED) metrics, service maps, and links to logs and traces.
- Traces: Allows exploration of individual traces, trace groups, and spans, and displays Gantt charts, cumulative service timing, and trace payloads.
- Discover: Offers ad hoc querying of logs and metrics using Piped Processing Language (PPL), SQL, Lucene, or Dashboards Query Language (DQL).
Setting up correlated log indexes
In OpenSearch 3.1, the Trace Analytics plugin now allows you to set up traces and service maps indexes, along with correlated log indexes with custom field mappings to support non-OTel log schemas, as shown in the following image.
Natural language features
The following AI‑driven capabilities streamline investigation:
- Text-to-PPL: Converts plain‑language questions into PPL queries.
- Data summarization: Provides concise summaries of query results and log fields.
To learn more about OpenSearch Dashboards AI capabilities, see OpenSearch Assistant for OpenSearch Dashboards.
Observability workflow
When monitoring services in production, a systematic approach to identifying and resolving issues is crucial. This walkthrough demonstrates how to use OpenSearch observability tools to quickly pinpoint and investigate service errors.
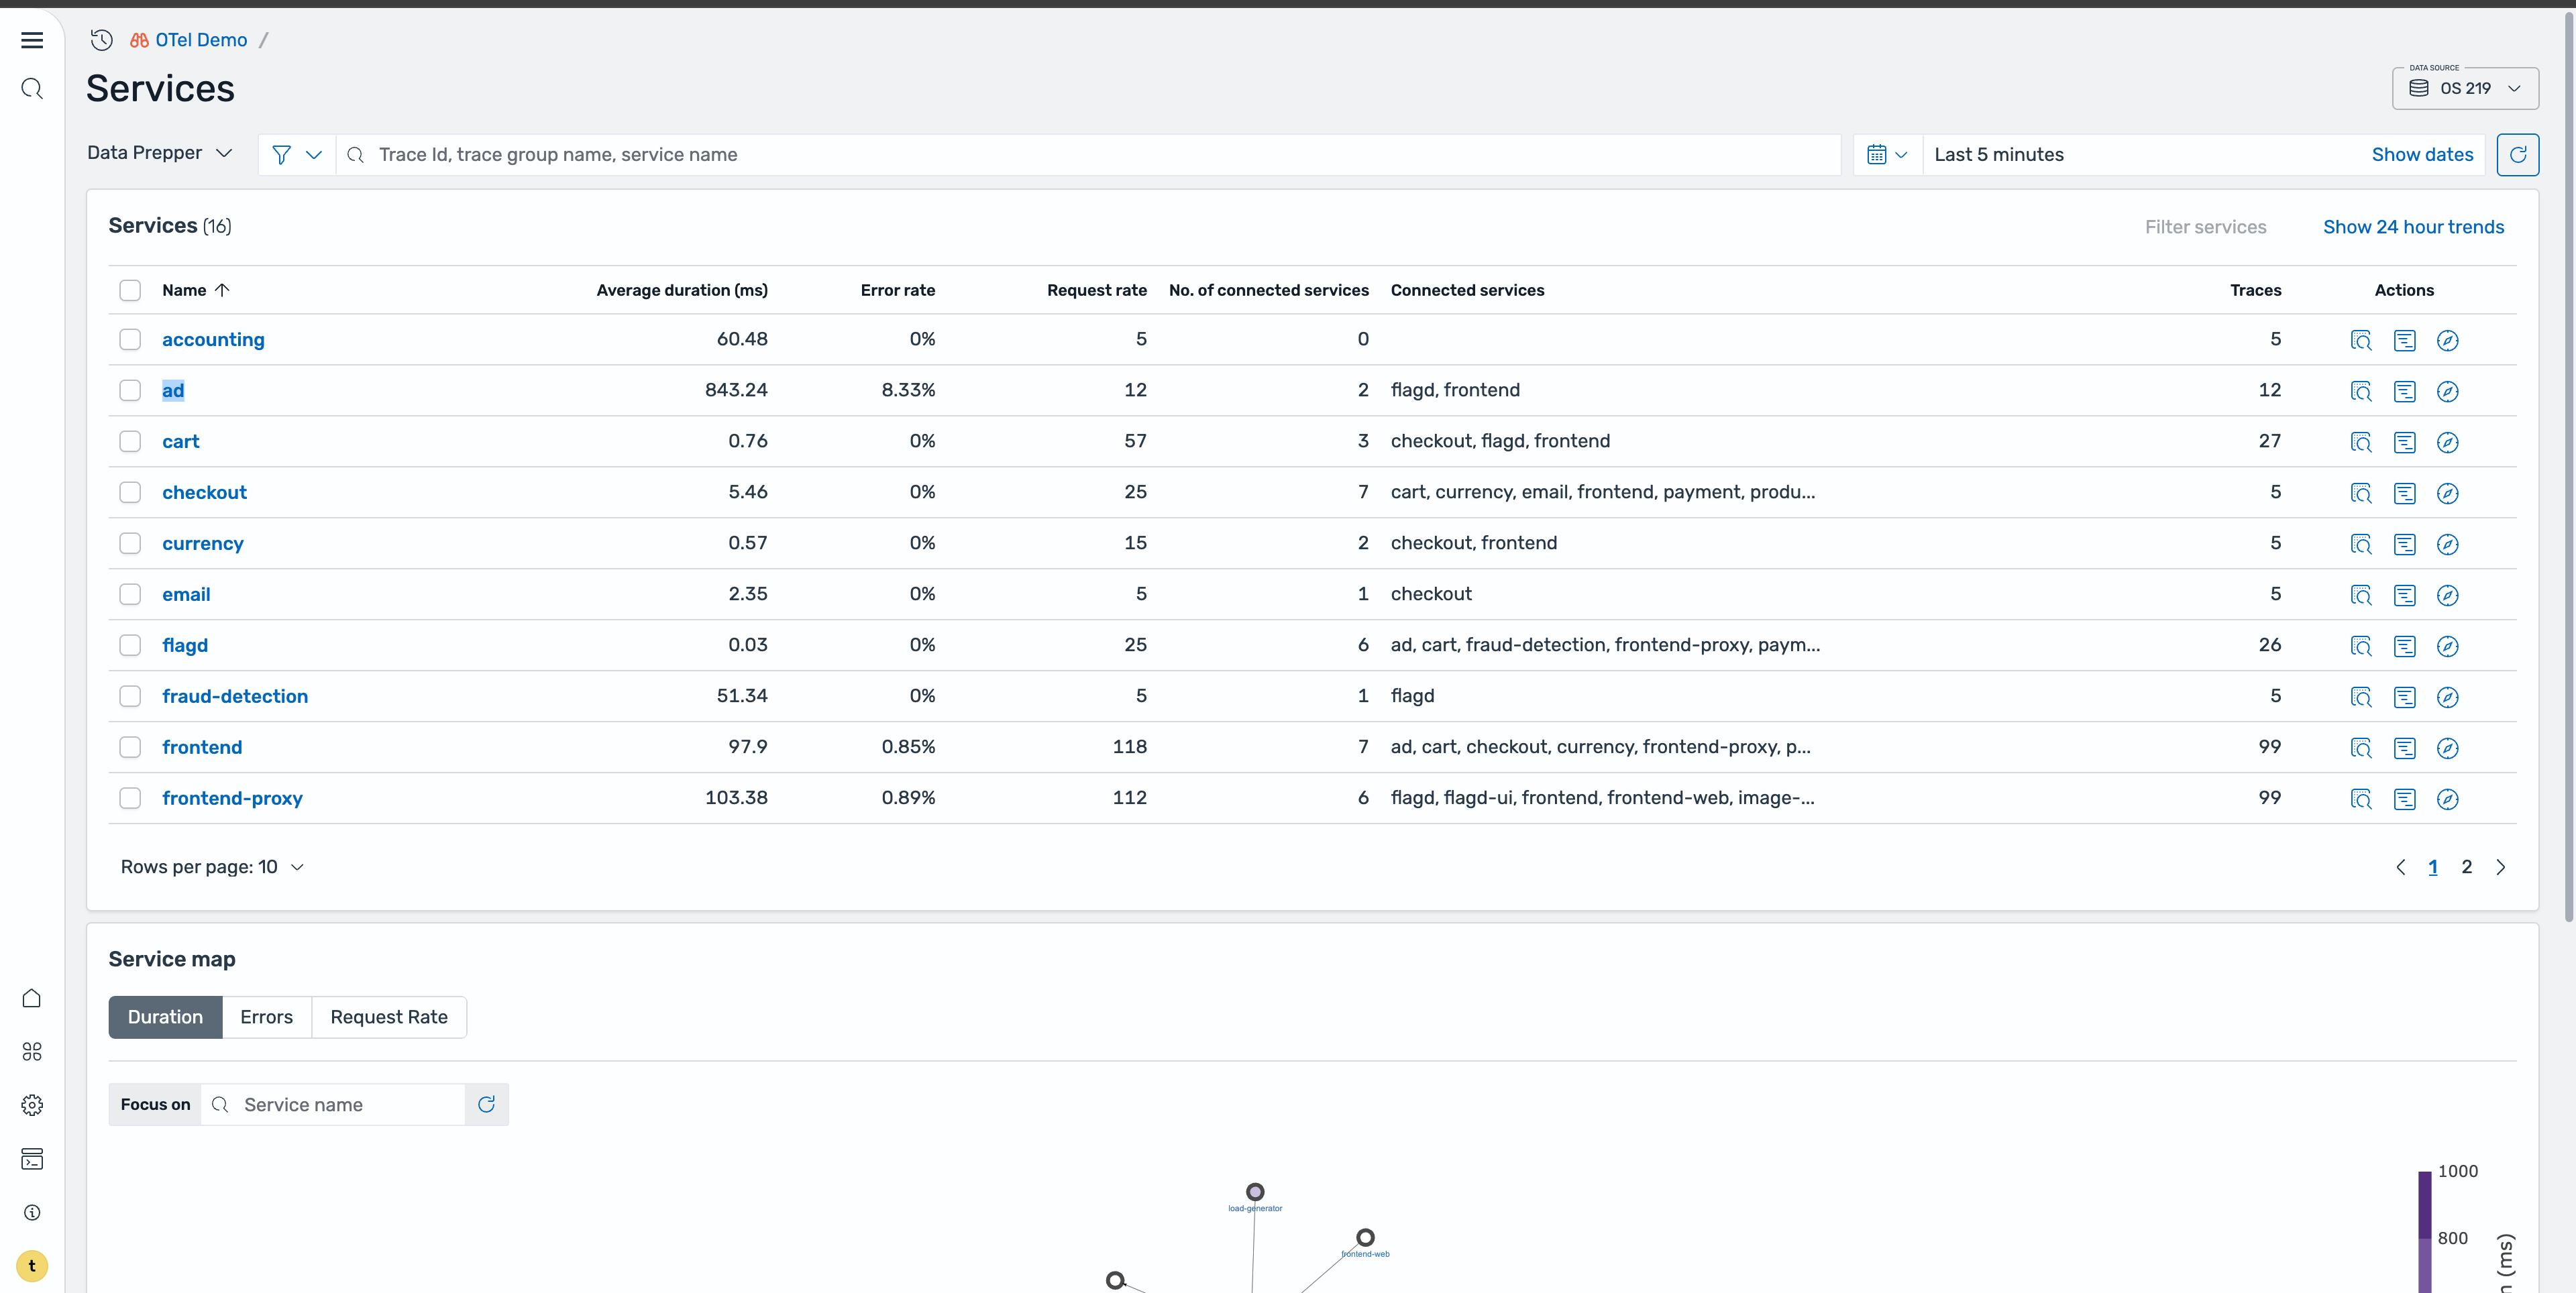
Step 1: Identify problem services
On the Services page, shown in the following image, you can get a high-level overview of all services and their health status.
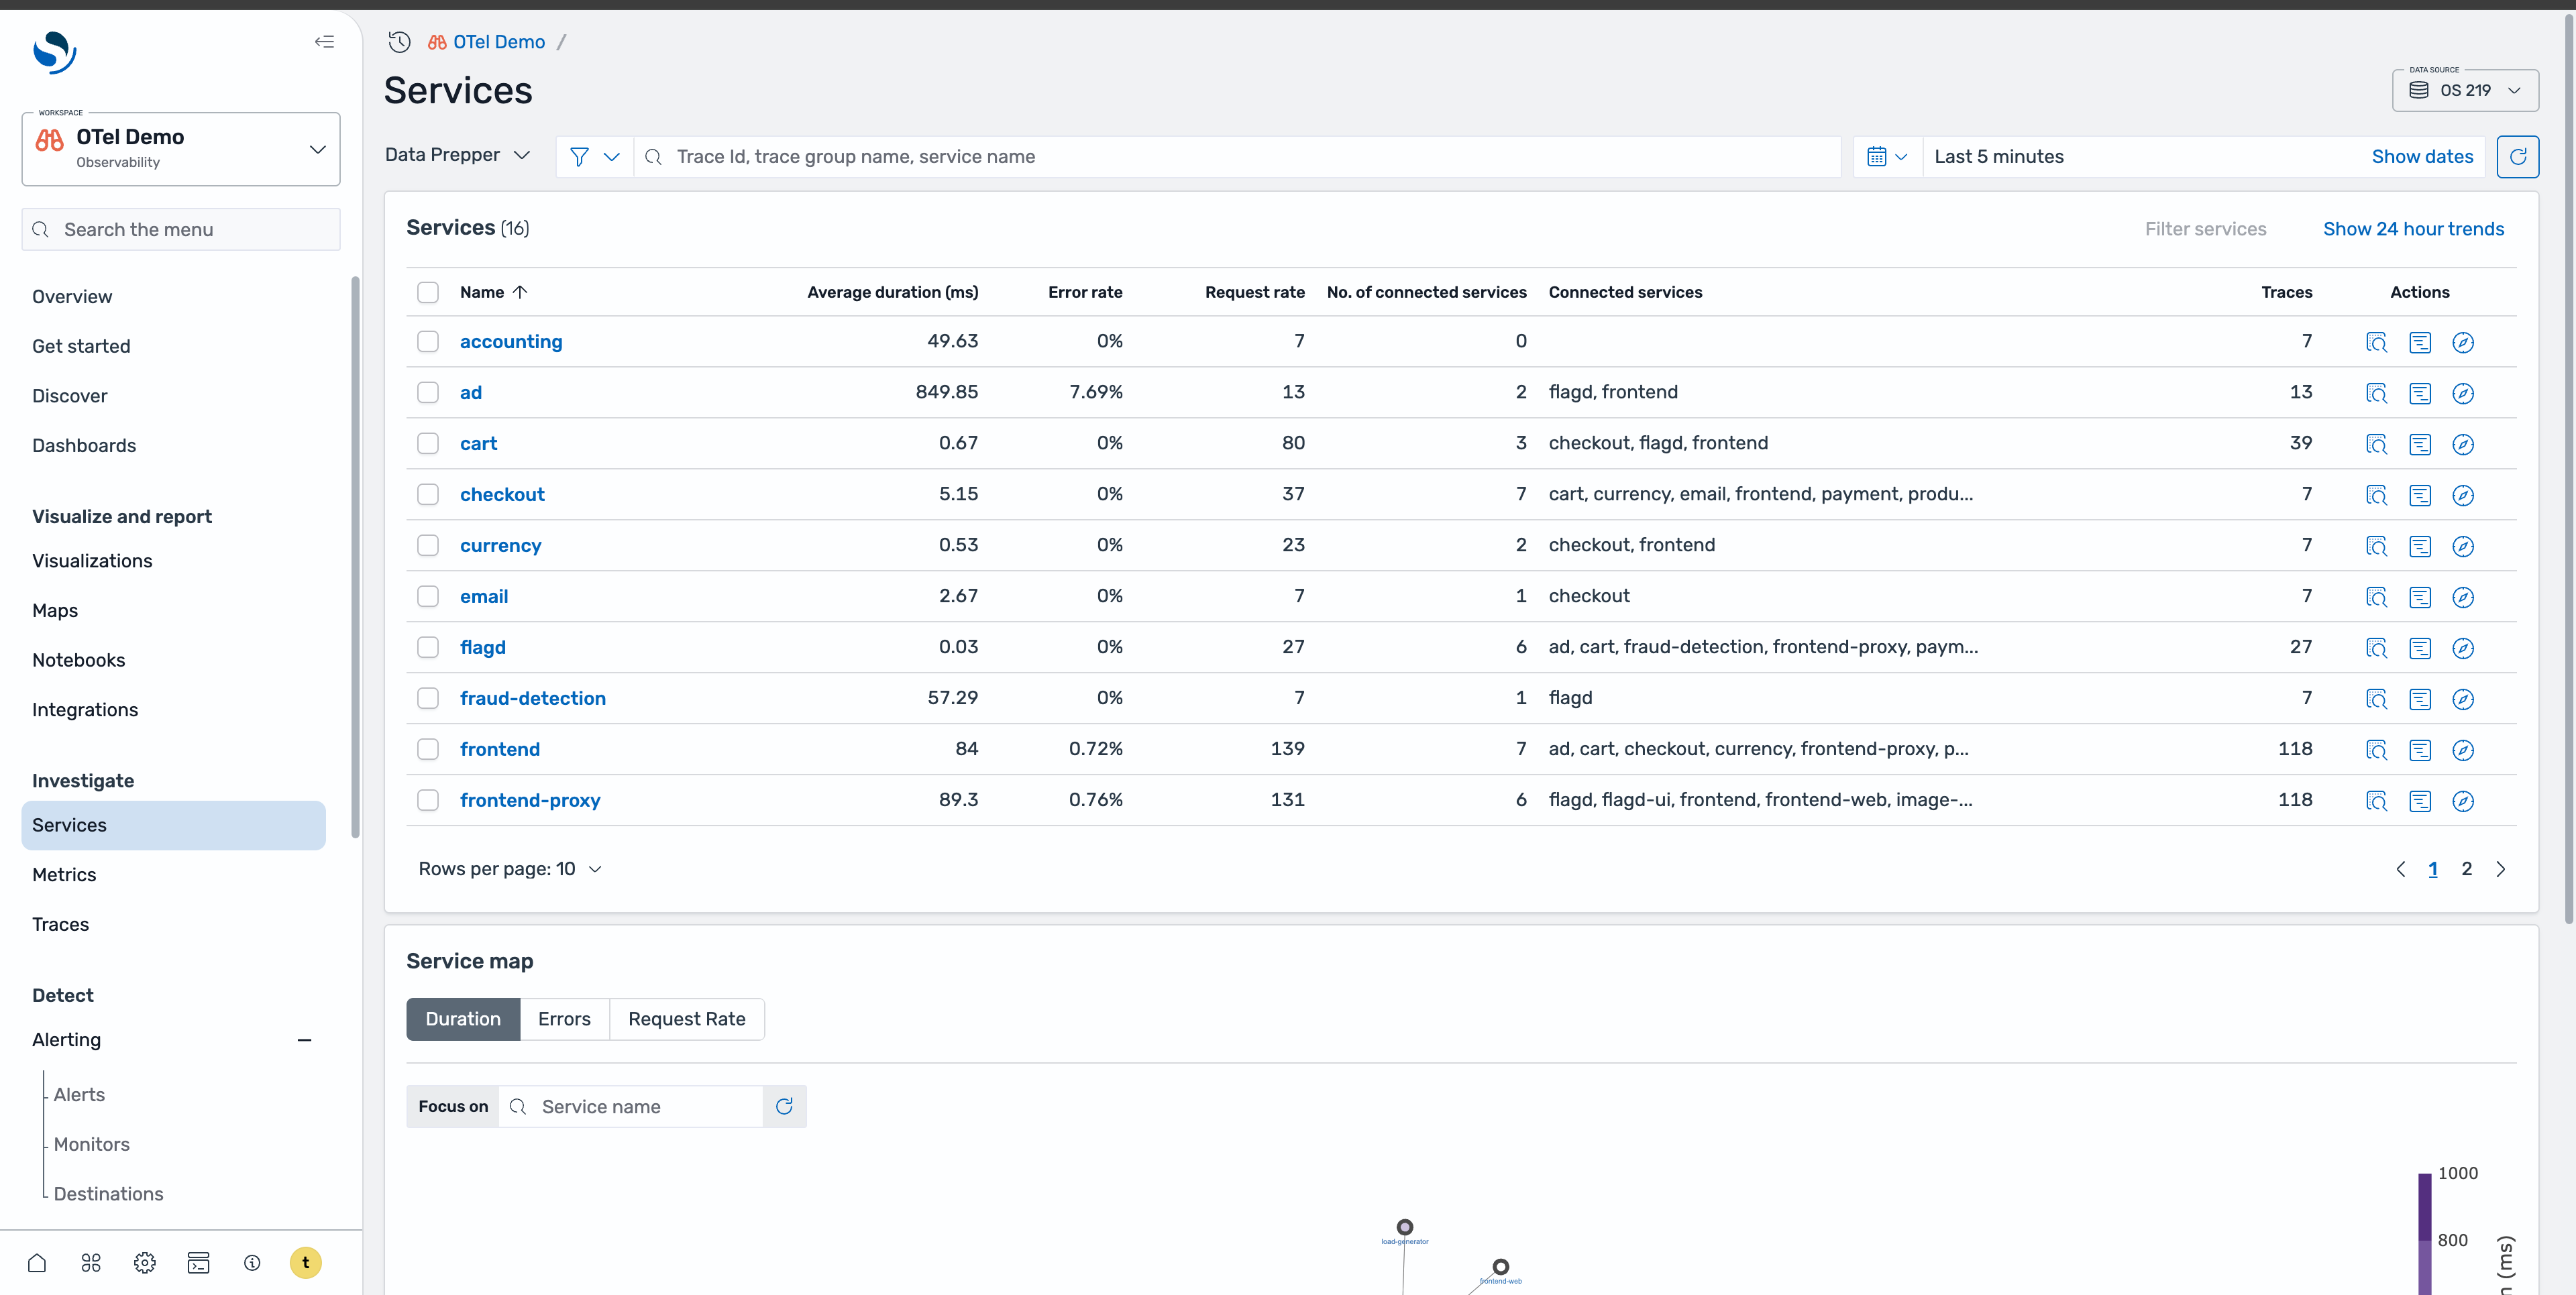
To quickly identify problematic services, sort by error rate to identify services with the highest failure rates. Alternatively, you can view the service map with the Errors tab selected to visualize which services are experiencing issues and how they’re interconnected, as shown in the following image.
Step 2: Navigate to the problem service
After identifying that the Ad service has a high error rate, select it to navigate to its dedicated service page. This page provides a more focused view of the problematic service, shown in the following image.
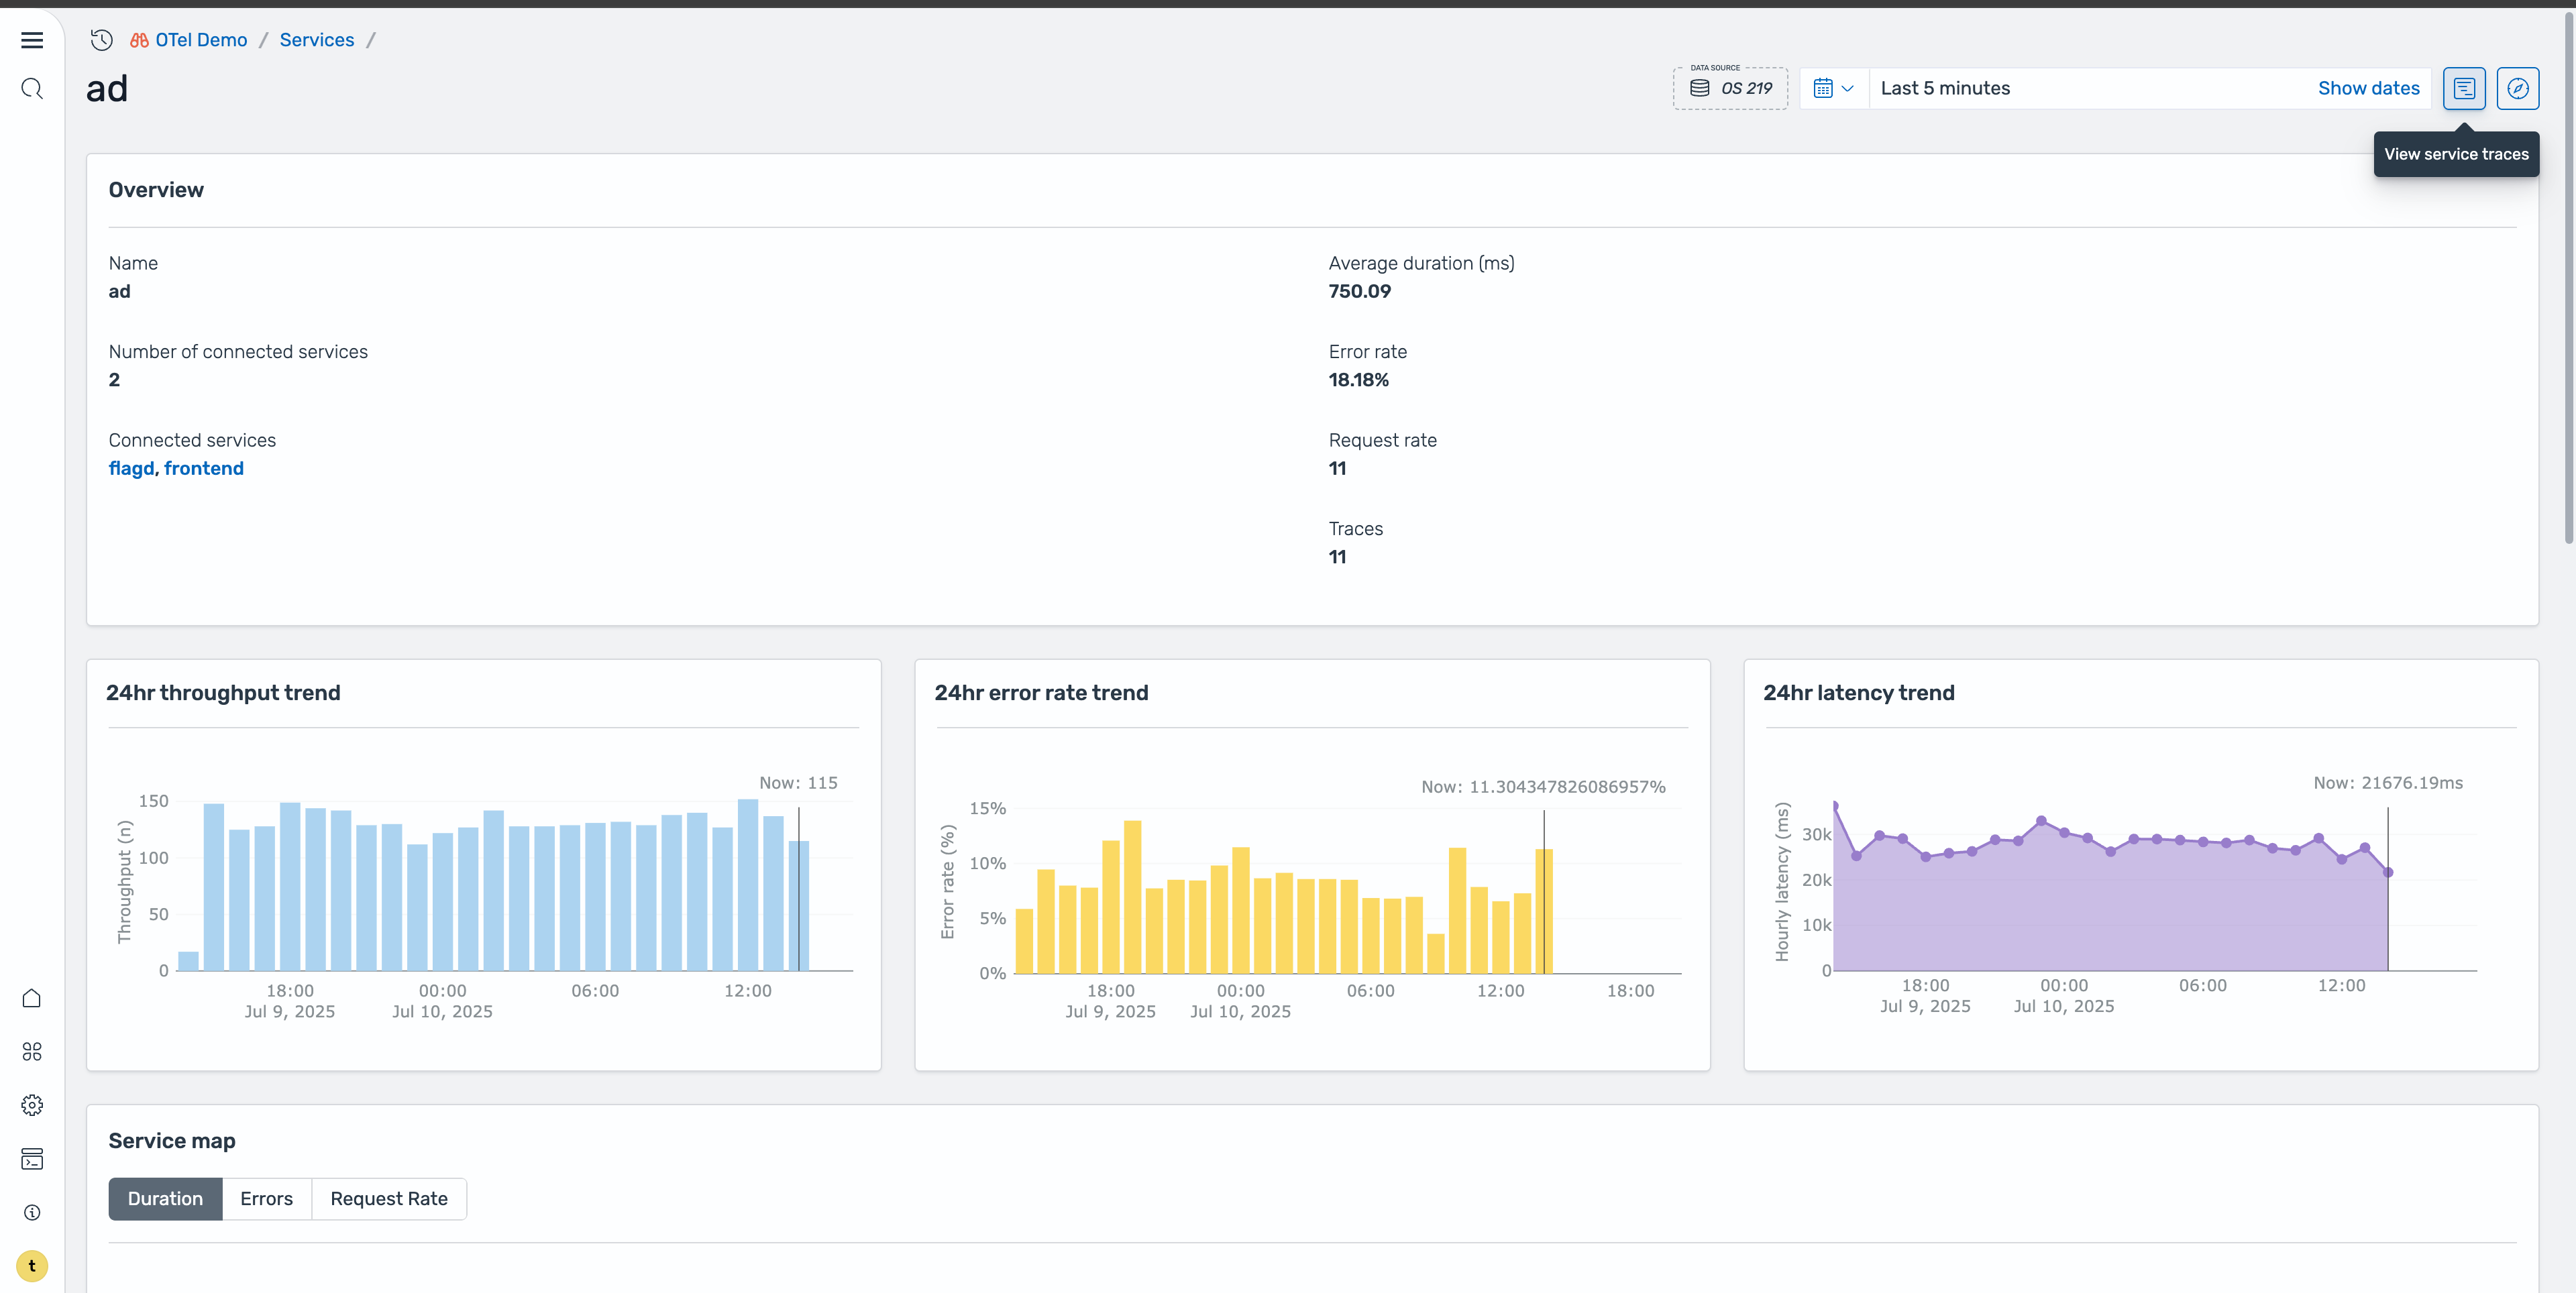
Step 3: Analyze service overview
On the Ad service page, you can view comprehensive overview metrics, including high-level performance indicators, error rate trends over time, service health patterns, and key performance metrics, as shown in the following image. The trends section helps you understand whether this is a recent issue or an ongoing problem.
Step 4: Investigate individual traces
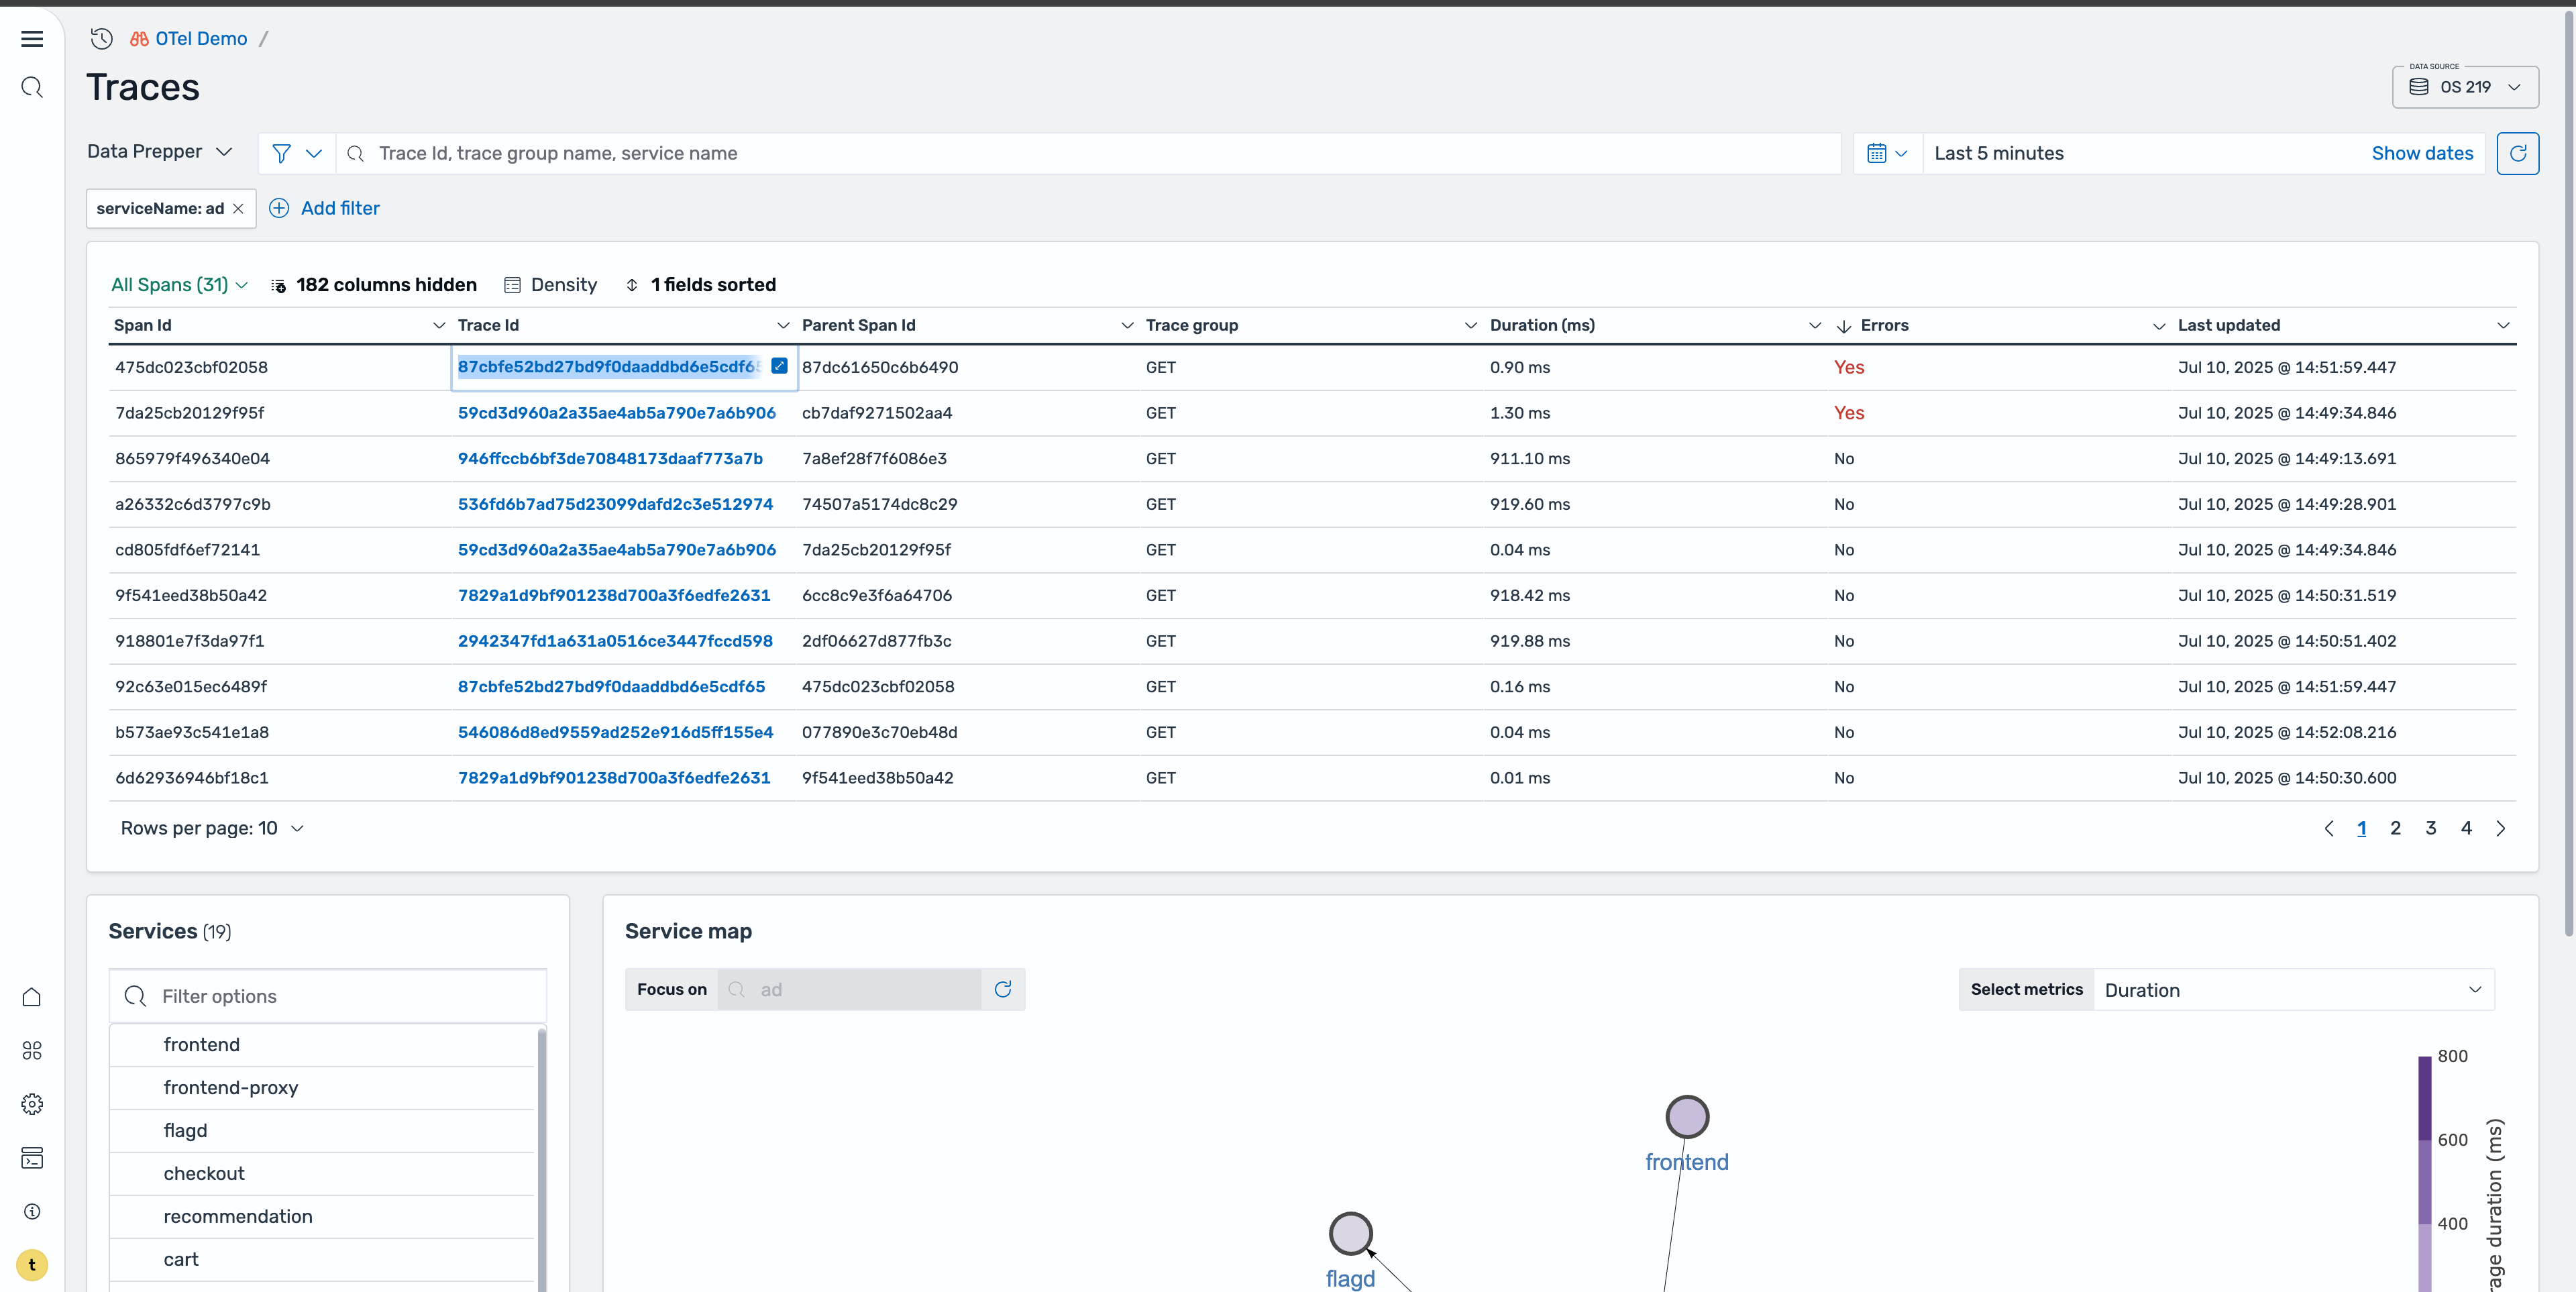
To dig deeper into the root cause, select the Traces icon to redirect to the Traces page with this service applied as a filter, as shown in the following image.
This is where you can examine individual requests and their execution paths. On the Traces page, sort by errors to isolate the problematic requests. This reveals two spans containing errors, as shown in the following image.
Step 5: Analyze the trace timeline
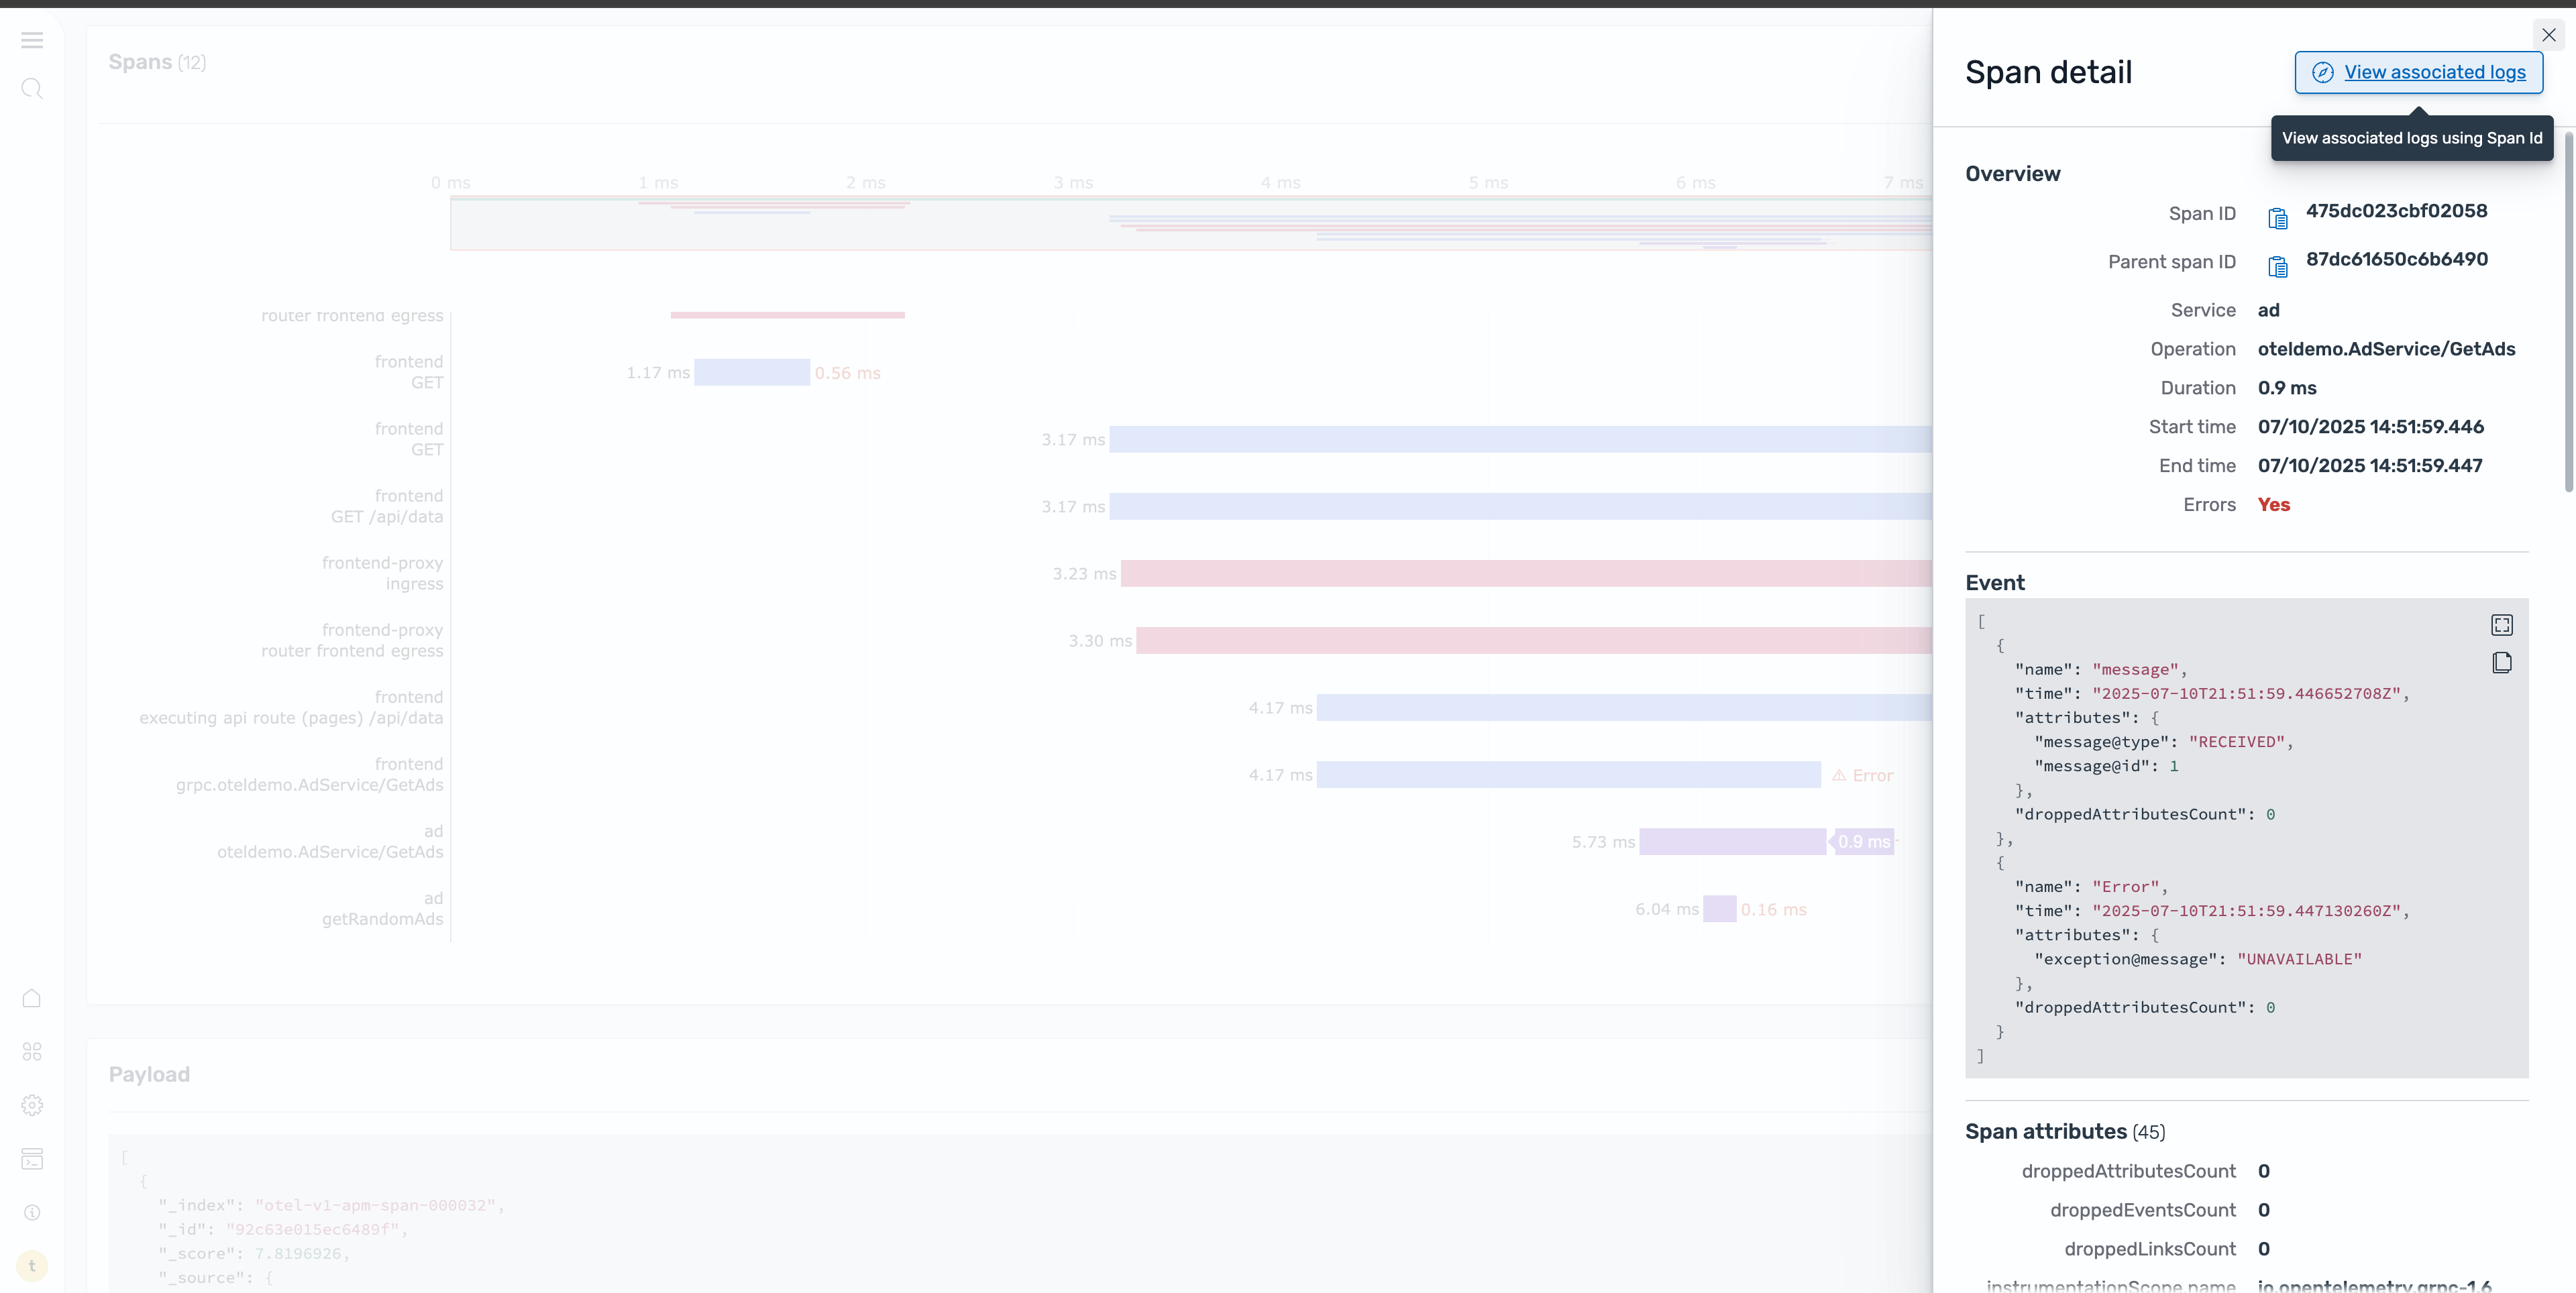
Select a specific trace ID to redirect to the Trace details page. On this page, you can examine the detailed execution flow of that particular request, as shown in the following image.
The Trace Details page provides a Gantt chart that shows the complete request flow across services, including timing information for each service call, error locations, and service dependencies and call patterns. In the image below, focus on the ad service span and select it to view more detailed information about the specific error.
Step 6: Examine error logs
To understand the root cause, navigate to the Logs page, which shows all log entries related to the error span, as shown in the following image.
By selecting the body field, you can quickly see the specific error message and context that led to the failure, as shown in the following image.
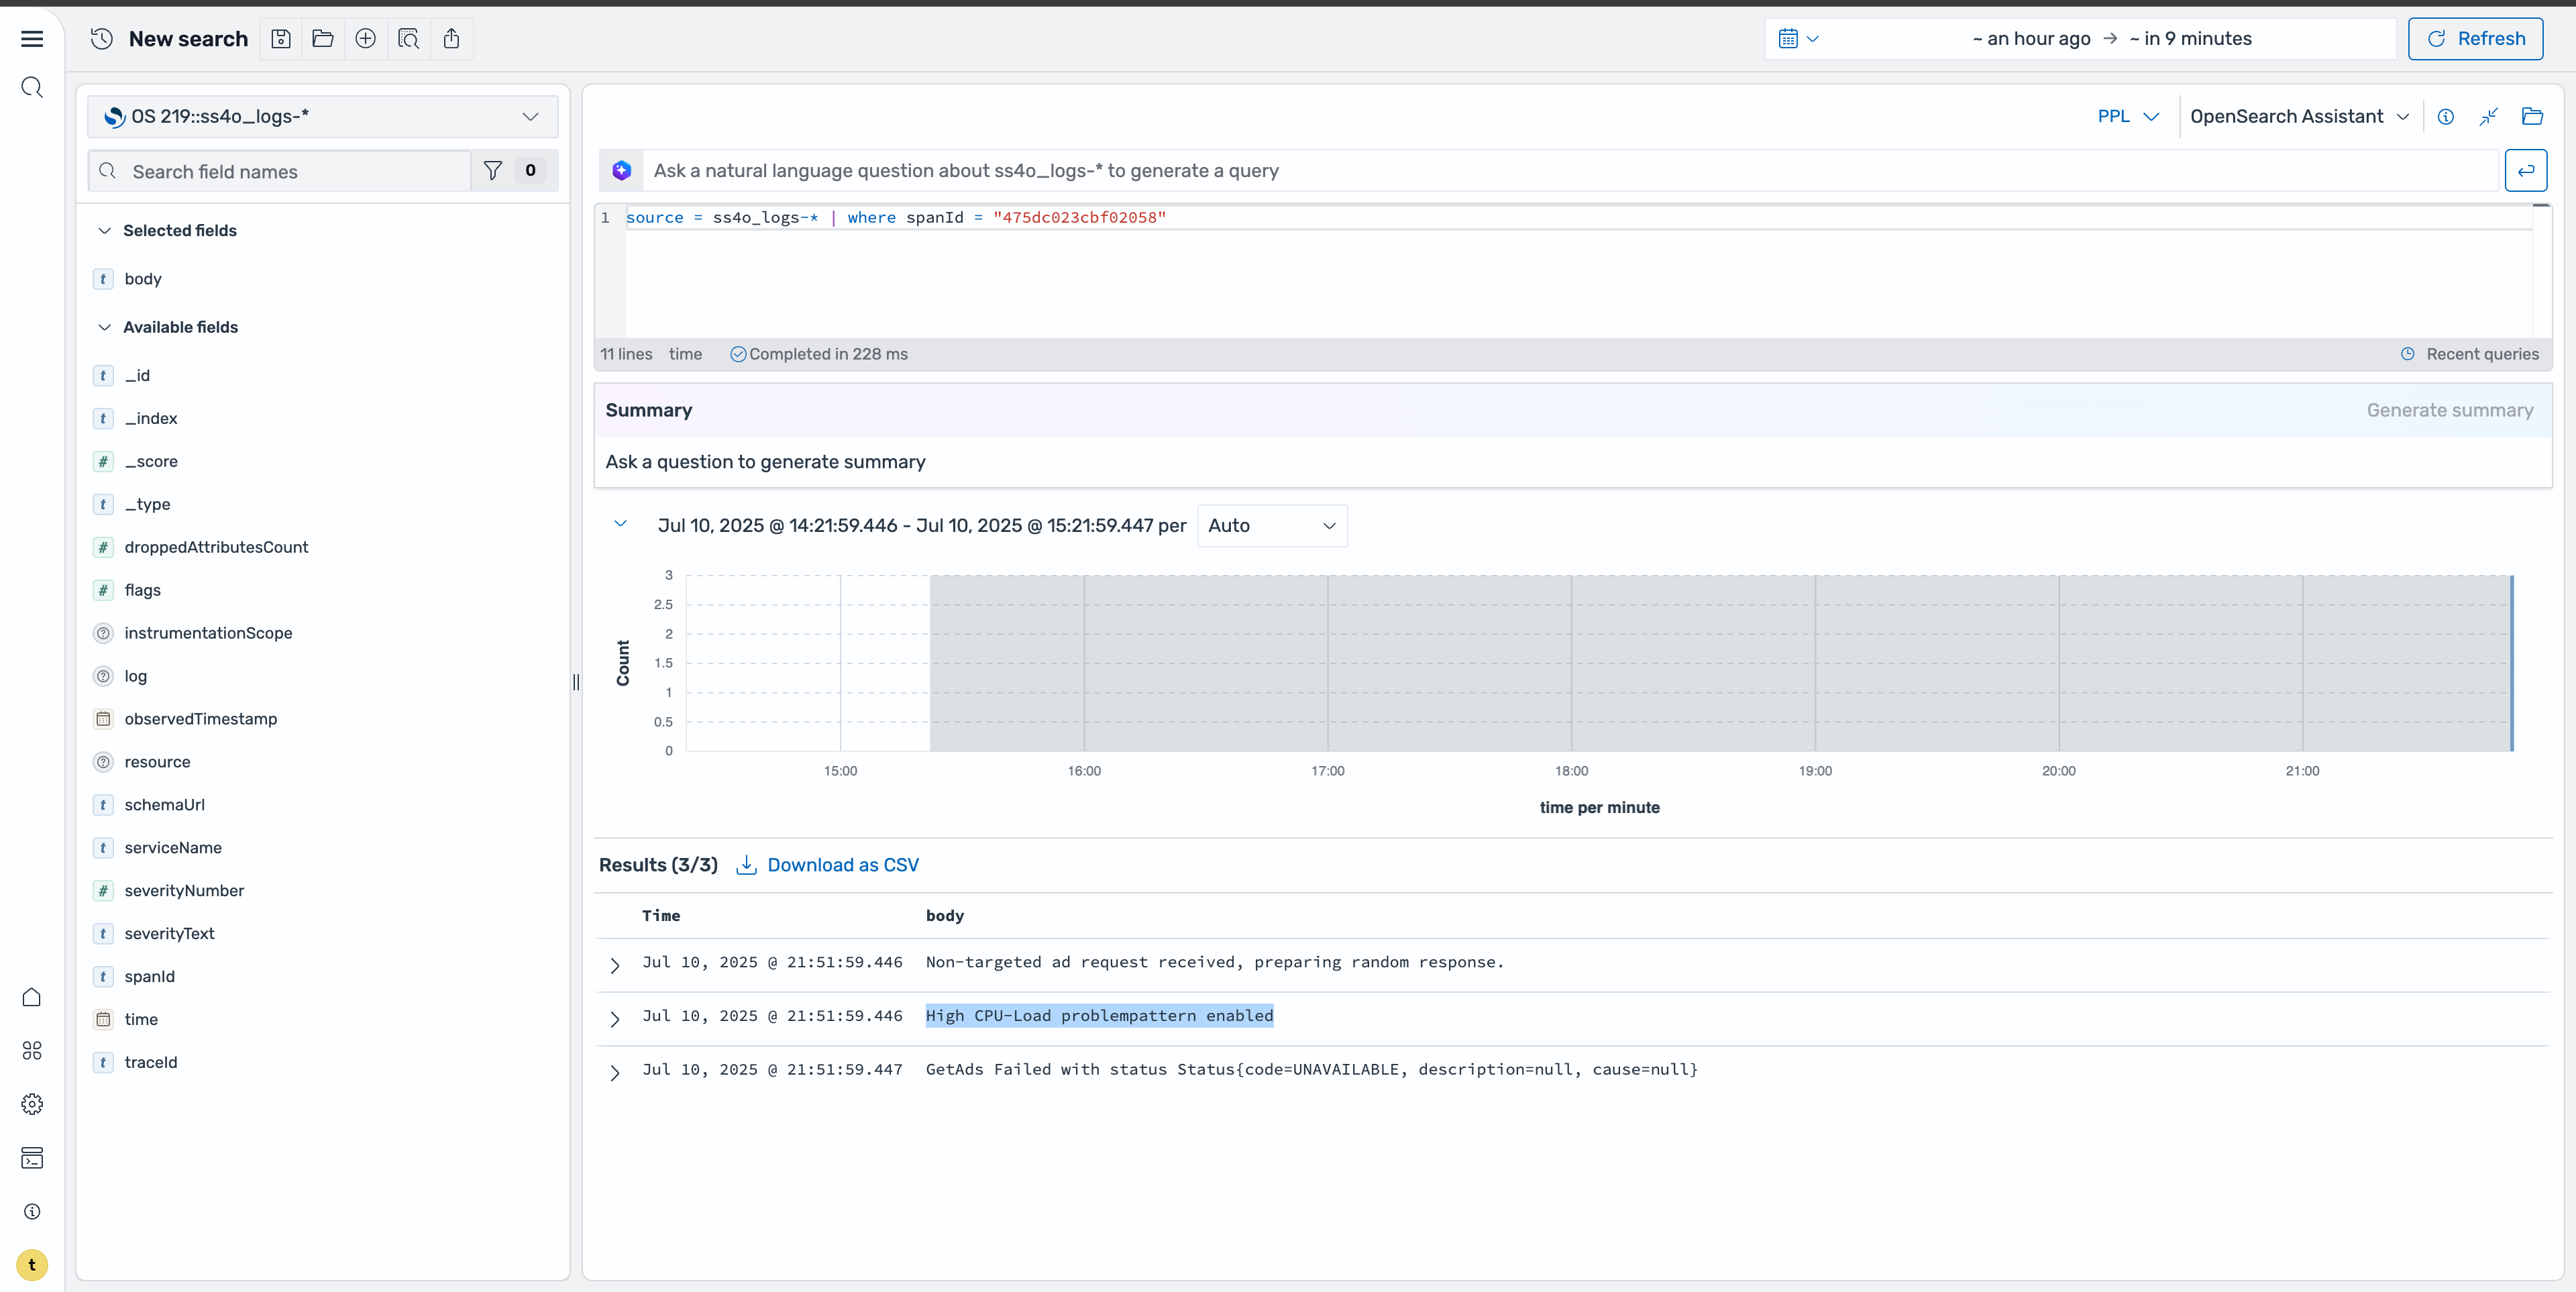
Step 7: Use natural language querying
For more advanced investigations, you can use natural language capabilities to query the data. Using a prompt such as “Show me the logs for span id ‘475dc023cbf02058’ and summarize the body field”, the system generates the appropriate query and provides a summary of the findings, as shown in the following image. This makes it easier to understand complex error patterns without writing manual queries.
Key takeaways from this workflow
This systematic approach provides the following benefits:
- Rapid issue identification by accessing service-level metrics
- Precise error location using distributed tracing
- Root cause analysis through detailed log examination
- Efficient investigation using natural language queries
By following this workflow, you can quickly move from detecting a service issue to understanding its root cause, enabling faster resolution and improved system reliability.
What’s next?
Ready to take your observability practice further? Here are some next steps:
- Try the OTel demo yourself: Set up the Astronomy Shop demo and experiment with service errors, tracing, and log correlation.
- Explore natural language features: Dive deeper into AI-powered features like natural language queries and data summarization.
- Integrate with your own services: Instrument your microservices with OTel SDKs and connect them to OpenSearch for deeper insights.
For more resources and documentation on the updates for traces and services in OpenSearch 3.1, see Trace Analytics plugin for OpenSearch Dashboards and Trace analytics.